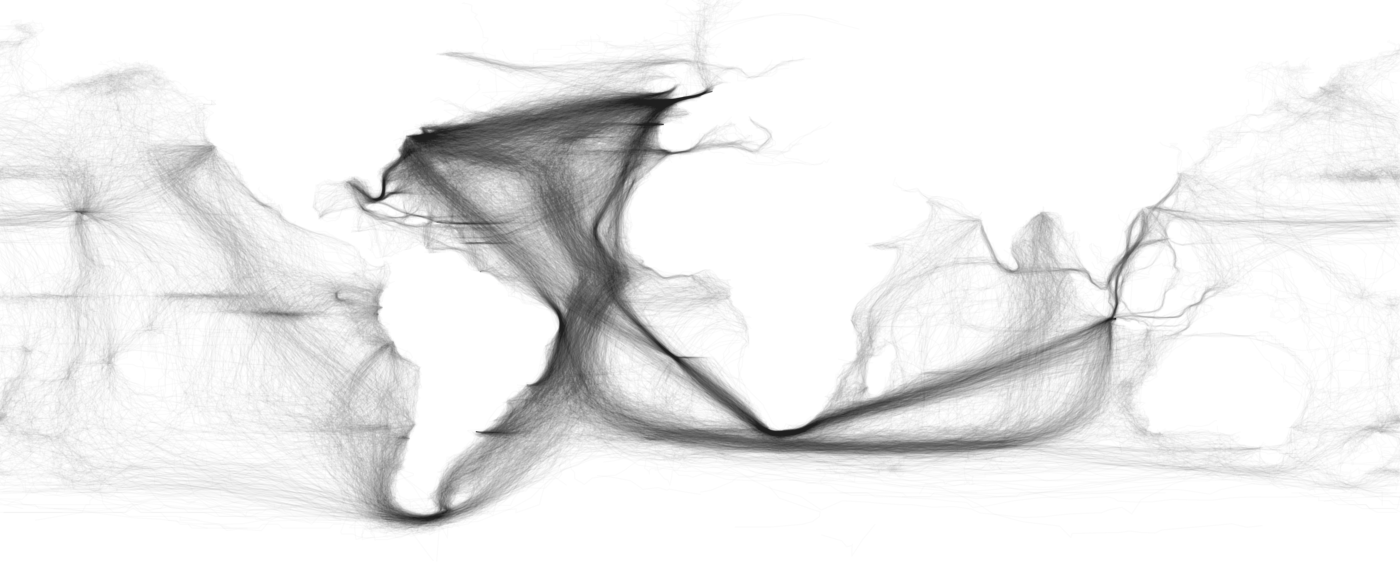
I saw these incredibly cool images of shipping routes over time (original source is assistant professor Ben Schmidt from Northeastern). They map actual voyages taken, ship by ship, so you can see not just the routes but the density of usage.
First, one showing routes from mid-19th century
Second, here is the same map done with data from 1980-1997.
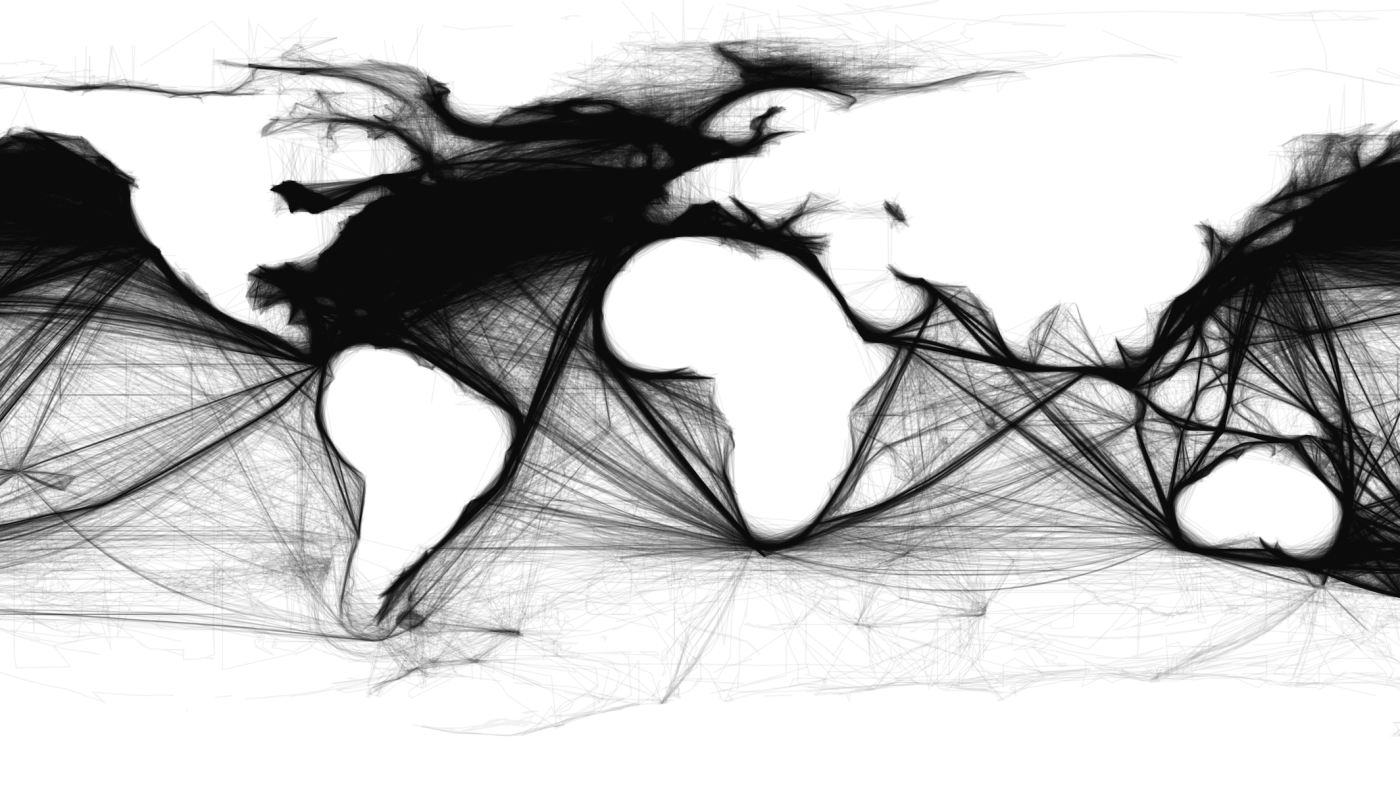
Very nice, quick summaries of the expansion in trade over a century. Shows the expansion of Asia, in particular, in this time period.