I will be teaching graduate growth and development this fall, and I'm trying to get a head start on my reading list. Today's effort is looking at the relationship of agriculture to overall economic development.
I think a really convenient way to see the main issues in this literature is the following figure. It plots output per worker (in logs) in both the agricultural and non-agricultural sectors against the share of labor in non-agriculture. Moving to the right, then, is associated with industrialization and/or structural transformation, whatever you want to call it. The data is from Francesco Caselli's handbook chapter (data here).
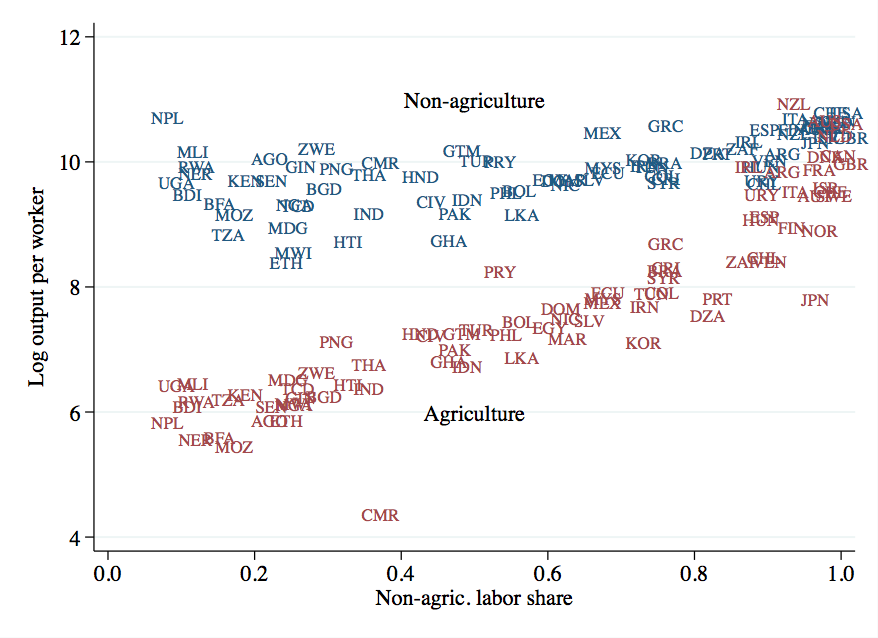
The figure contains within it several important stylized facts that motivate current research. First, think about how to explain the variance in aggregate output per worker between countries. This depends on variance in agricultural output per worker and variance in non-agricultural output per worker. For agricultural output per worker, note that there is a much higher variance. The range along the y-axis is much bigger, from 6 (roughly $403 per worker) to almost 11 (nearly $60,000 per worker). The variance in non-agricultural output per worker is much smaller, ranging only from about 8.5 ($4900) to about 11 (again $60,000). A huge part of the variance in overall output per worker across countries is driven by differences in how productive agricultural workers are.
The second fact that jumps out is the tight correlation of the non-agricultural labor share and agricultural output per worker. Countries that have the lowest agricultural output per worker also tend to have the most people in that sector. The poorest countries - Nepal (NPL), Uganda (UGA), and Mozambique (MOZ) for example - are poor because their agricultural workers produce very little, and most of their workers are agricultural workers. It's a double-whammy.
Third, there is a gap in output per worker between agricultural and non-agricultural workers, but this gap shrinks as the non-agricultural labor share rises. For the poorest countries, the gap implies that a non-agricultural worker produces something like 30 or 40 times more than an agricultural worker (and there are even more extreme examples, like Nepal, where the ratio is 130-1). But as the non-agricultural share of workers rises, these gaps fall to something like 1.5 to 1.
In thinking about why some countries are rich and some are poor, these stylized facts are of first-order importance. Standard one-sector growth theory sweeps all this under the rug. The papers I teach in this area take these facts as a jumping-off point. They generally work with a model that has a low income elasticity for agricultural goods (Engel's Law), so that as productivity goes up in either sector, labor is pushed/pulled out of agriculture. Other papers take off from this to consider the existence of the productivity gaps, either trying to account for them more accurately, provide some explanation for their existence, and/or explain why they disappear as countries industrialize.
The reading list itself can be found on the "Papers" page on the site, below the introductory papers. It includes both a pdf and a BibTeX file.