That’s the title of Greg Clark’s article from 1987 on cotton production in the early 20th century. Clark uses that specific industry to study the sources of variation across countries in real wages. I revisited it recently because I want to use it in my graduate course, and because I think it lays out a clear case for what could be loosely called a “cultural” explanation for differences in development. In short, the paper is going to come to the conclusion that poor countries are poor because of some unknown cultural source that supports a norm of low efficiency of labor.
The key to the paper is that Clark can compare outcomes across different countries that are using essentially identical technology. The spinning machines and looms being used by cotton manufacturers in essentially all countries at this time were designed, built, and commonly installed by English engineers. If anything, because they were relatively young industries, other countries in the early 20th century had better machines than their English peers. So Clark is able to compare the performance of different countries in producing cotton using an identical technology.
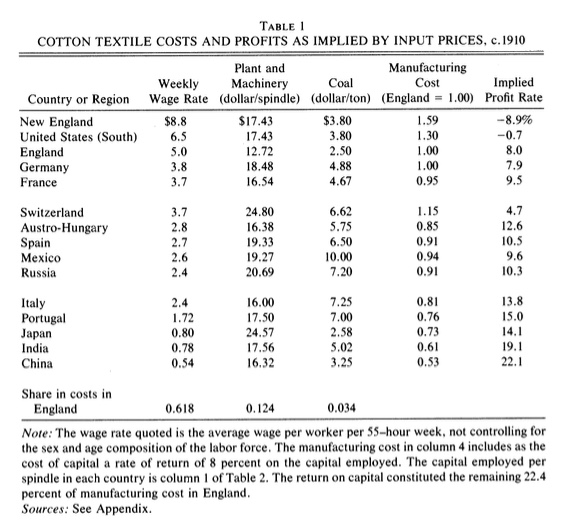
To do this, Clark works comes at the problem from a slightly different direction than the typical macro/growth paper would. Take a look at Clark’s Table 1, which contains most of the information we need to talk about the story here.
Let’s start with Clark’s method, and then below I’m going to compare that to the macro/growth approach. He asks two questions, one kind of obvious and one not so obvious.
- What rate of return on capital (“implied profit rate”) would an English cotton factory earn if it faced the same input prices in country X?
- What price could a factory in country X charge for cotton cloth and still earn an 8% return on capital (“manufacturing cost”)?
Question 1: To answer the first, it is crucial to realize that Clark is assuming that the English factory is going to use the exact same proportions of workers, capital, and coal no matter the input cost. They are going to produce the exact same amount of output, sell it for the exact same price, and earn the exact same revenue. In other words, this technology is Leontief in this experiment. The only difference is going to be in how much they pay for inputs.
One other nit-picky point is that the column in Table 1 called “Plant and Machinery” is the cost of capital in the sense of paying for depreciation costs. It is not the amount of capital used (which is listed in Clark’s Table 2).
The final row of Table 1 gives you the cost shares for an English firm, and we need this to back out the implied cost shares for other countries. For example, in England 61.8% of revenues get paid to labor. But in China, because wages are 0.54/5.0 = 0.108 of English wages, the share of revenues being paid to labor is only 0.108 x 0.618 = 0.067. Using a similar calculation, the share of revenues paid out for capital depreciation is 0.159 in China, and the share for coal is 0.044. In total, 0.067 + 0.159 + 0.044 = 0.270 of revenue is paid to inputs, meaning that 0.73 of revenue is paid to owners of capital. In comparison, only 0.224 of revenues are paid to owners of capital in England, mainly because wages are so high.
From Clark’s Table 2 (not shown), the actual capital used in China is 17.76, while in England it is 15.06. Since 0.224 of revenue in England is assumed to provide an 8% return on 15.06 units of capital, revenues must be 0.08x15.06/0.224 = 5.379. This number is meaningless, except that it allows us to calculate the return on capital in China, which is 0.73x5.379/17.76 = 0.221. Hence the 22.1% implied profit rate for China in Clark’s Table 1. Lather, rinse, and repeat for the other countries.
Did firms in China actually earn 22.1% on their capital? No! That’s the whole point of the paper. They didn’t. If they did, we’d expect to have seen a massive shift of cotton cloth production towards China, or Japan, or any of the many other places earning higher profits than England or the US. But we did not, so there must be something that kept the majority of cotton cloth production in England. In short, they must not have been able to produce as much given those same inputs.
Question 2: What I’ve called Clark’s second question is not something he says explicitly in the paper. But I find it a better way to understand what is going on in his “manufacturing cost” column. Very simply, set the English price of cotton to 1.0. What price would a given country have to charge to earn exactly 8% on their capital?
First, for China to earn 8% on their capital, only 17.76x0.08/5.379 = 0.264 of their revenues would need to be paid to capital owners. Their inputs are taking up only 0.270 of revenues. So Chinese firms need to only generate 0.264+0.270 = 0.534 of the revenues of an English firm to create an 8% return on capital. In other words, they could cut revenues to 53% of an English firm (perhaps by lowering the price to 53% of English prices) and still match the 8% return.
This is what Clark means by “manufacturing cost”. It’s the cost of producing an 8% return to capital, matching his assumed norm for English firms.
Either way, it is clear that Chinese, and most other countries, were relatively low cost and/or could have offered lower prices if they in fact could produce as much as English firms. But they cannot, and the whole rest of Clark’s paper is exploring reasons for why they could not produce as much as English firms.
Let’s start with two things that do not explain the differences across countries:
- Technology. Like I said above, the beauty of this paper is that Clark can establish quite clearly that the firms in all countries used essentially identical machines. For all intents and purposes, they were operating with identical technology and capital. So this doesn’t explain the difference.
- Capital utilization. Perhaps China or other countries worked fewer hours, and we’ve incorrectly assumed that they worked as many hours as English workers. But Clark shows in his Table 2 that most other countries worked for more hours than England. The mystery is in fact even deeper. With high hours in China, it should have made them even more profitable.
Now we get to the heart of Clark’s explanation, worker efficiency. He shows, in his Table 3 copied below, that the amount of capital per worker was very different across countries. His original question assumed it was identical (Leontief).
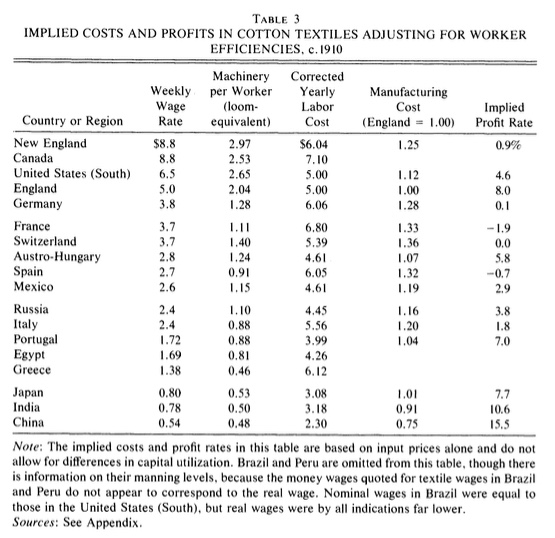
You can see that English (and US/Canada) used far more machines per worker than China or India or other countries. So the labor cost for China was in fact very different than England. Paying a Chinese laborer 0.54 didn’t get you the same amount of work as paying an English laborer 5.0. In England, to operate 2.04 machines, you hired one worker. In China, to operate 2.04 machines you had to hire 2.04/0.48 = 4.25 workers. And so the true labor cost in China was 4.25*0.54 = 2.3.
This changes the implied profit and cost calculations in the final two columns. Note that the vast majority of the countries now are higher cost than England, and earn a much lower implied profit rate. In the US, this is because labor is expensive. In China and others, it is because workers don’t operate as much capital as in England.
So now Clark asks why machines per worker are so low in some places. Or if you like, why there are so many workers operating each machine.
- Substitution of labor for capital? In this case, not only is production not Leontief, but there is a high degree of substitution allowed. Perhaps India/China used lots of labor in place of capital, and hence could achieve high output per unit of capital, even though output per unit of labor was low. Except, no. Clark shows evidence that they did not produce more per unit of capital. It really is a low efficiency of labor used.
- Differences in cotton quality? No, it doesn’t appear that India/China used extra labor because they were using higher quality cotton that required more attention.
- Worker experience? No, this doesn’t appear to make sense. Average years of experience were higher in England, but not by much, and not universally compared to the other countries. Moreover, Clark provides some evidence that the returns to experience within mills was relatively low, as evidenced by some places relying almost exclusively on young women who only worked for a few years before they got married.
- Worker quality? No, interestingly enough. Clark’s evidence here is that immigrants to the US from these other countries earned just as much as their peers. French immigrants (who in France were only 54% as efficient as English workers) earned essentially an identical wage to English immigrants in the US. Simliar for Mexican, Russian, Italian, and Japanese workers.
This last point is telling. The workers in other countries are entirely capable of working at the efficiency of an English or US worker, but for some reason they do not. (You might worry about selection of immigrants; Clark argues that the selection effect would have to be ridiculously large to account for this data.)
So we are left with what Clark calls “local effects”. Workers in China or India, for example, are just as inherently skilled as anywhere else, but the norm in China or India is that they do not work as efficiently. Clark has a quote (from India) referring to this:
The operatives in this mill refuse to attend to more machinery. I watched two ring frames for three minutes; there was not a single end down, yet the workpeople would not look after more than one side. They said they were satisfied with the present wage, and that there were too many men who want work and cannot get it that it would be unfair if they were to attend to more machines.
Is this “culture”, as Clark later alludes to? If you think this is something particularly “Indian”, then I guess so. But I’m not sure that the attitude expressed here necessarily varies by culture. It is entirely plausible that India, with a dearth of capital, saw workers expressing an attitude that any country with a dearth of capital would express. The explanation may still be a feature of low capital stocks, not something cultural. If there is something Leontief about cotton technology, then the limit on cotton employment is the stock of machinery, which is something that conforms with the quote. And we could certainly imagine that if English workers faced the same dearth of capital, they could take the same attitude towards work.
That said, there is something about the “local effects” to be explained. Why did the cotton industry persist so long in Britain, despite the drag of high wages. Surely at some point it had to make sense to try and relocate capital to low-cost countries? Could it be an institutional friction - risk of expropriation - that prevented people from taking advantage of the high implied returns in other countries? If it is cultural, then this culture doesn’t apparently travel with natives, otherwise the immigrants to the US wouldn’t have been as productive. This is different than what most modern research on culture would suggest; it tends to find that cultural traits travel with migrants.
The big story of the Clark paper is that technology is not sufficient to explain massive differences in outcomes. And this sets it up as an alternative story to the one from Comin, Easterly, and Gong that I recently posted about. For CEG, technology itself differs, and this difference persists. If you extrapolate Clark’s work, technology is similar, but the local effect of culture varies, and that is what presumably creates persistence in outcomes.
A Comparison to Growth/Macro
A quick aside about how a modern macro/growth paper would approach this. In short, you’d be doing a variance decomposition on the real wage in Clark’s data. More precisely, you’d be doing a variance decomposition of the log of real wages.
The variance of log real wages in Clark’s data is 0.645, a number that means nothing by itself. The question is what fraction of the variance could be explained by variation in capital per worker or coal per worker. The remaining fraction is then attributed to the residual. To calculate this, you need the weighted variance of log capital per worker and log coal per worker.
The “weighted” part of this is the importance of capital or coal in production. How do you find these weights? You look at the cost shares. And here is the crucial difference between what a macro/growth paper would do and what Clark did. Macro/growth is going to take the English cost shares and assume that these are the same for all countries. In other words, we’d assume Cobb-Douglas production functions, as opposed to Clark’s implicit Leontief.
(Aside: We don’t know the actual amount of coal used, but to get around that we might assume that the coal/capital ratio is the same across countries. If we can’t, then I don’t know how to proceed, so bear with me. This simply means that the variance of log coal per worker is identical to the variance of log capital per worker.)
Anyway, the weighted variance of log capital and log coal per worker is either 0.0188 (if you use Clark’s index of capital) or 0.0381 (if you use Clark’s data on looms equivalents). Either way, this is only 2.92% or 5.90%, respecitively, of the total variance in real wages. A tiny fraction of variation in real wages is driven by differences in capital per worker, and the rest must be explained by technology, human capital, or something else. Clark has disposed of technology as an explanation, so it could be human capital. Clark eliminates big human capital differnces (at least in terms of age structure or experience), so it has to be “something else”. That something else is either local effects or culture, depending on your choice of terms.
Is this a better method? No. Clark’s initial assumption of Leontief technology may be more appropriate here. Or it may not. We don’t actually know. Both Clark and the macro/growth literature are making assumptions about production functions that partly drive their results. In either case, we get that differences in the stocks of capital per worker are not entirely sufficient to explain why some places are rich and some are poor.