John Cochrane wrote a piece for the Wall Street Journal’s Confirmation Bias Opinion page. It used the World Bank’s Doing Business index to suggest that the US could achieve massive gains in economic growth by adopting policies that pushed up our Doing Business score.
Brad DeLong and Evan Soltas had at the post. DeLong saying that Cochrane’s attempt to forecast out of sample the relationship of the DB index and GDP per capita was flawed. Soltas took a look at distinct shocks to the DB index in a attempt to alleviate the obvious “correlation is not causation” problem inherent in Cochrane’s piece.
I wasn’t planning on saying anything else about this, but Cochrane posted another piece on his blog that included a figure pulled from my book with Chad Jones. Which got me looking more closely at his original piece. Which frustrated me. So here we are.
Growth Economics with Nigel Tufnel
Below I’m going to get to the gory details of why the Doing Business (DB) indicators generally suck as a measure of anything useful. But let me start with this note. The DB index Cochrane uses is a “distance to the frontier” index. Meaning you get a number that tells you how close to best practices in business conditions a country gets. If you are at the best practices in all categories, you’d get a 100.
Cochrane says, and I quote, “If America could improve on the best seen in other countries by 10%, a 110 score would generate $400,000 income per capita…”. Stew on that for a moment. Think about how that DB frontier index is constructed.
Cochrane went there. He said it could go to 11.
Apples and Oranges
But there is a more basic problem, one which DeLong and Soltas implicitly concede to Cochrane. And that is in believing the DB distance to the frontier is a meaningful way of measuring …. doing business, I guess.
The distance to the frontier number is attempting to aggregate imcomparable quantities. Channeling my inner Nick Rowe, let’s use fruit to make a point. Alice has 10 apples and 5 oranges. Bob has 3 apples and 4 oranges. How would the World Bank calculate the “Doing Fruit” distance to the frontier index? First, we have to establish both the best and worst performance by fruit. For apples, this is easy. The frontier amount of apples is 10, the worst amount of apples is 3. But we can’t do that for oranges, because the WB has arbitrarily set up standards that imply that the frontier amount of oranges is 7, while the lower bound is zero.
According to the WB procedures, Alice’s distance to the frontier in apples is (3 - 10)/(3 - 10) = 1. That is, Alice is at the frontier. Alice’s distance to the frontier in oranges is (0 - 5)/(0 - 7) = 0.714. She’s 71% of the way to the (arbitrary) frontier. For Bob, his apple distance is (3 - 3)/(3 - 3) = 0, and his orange distance is (0 - 4)/(0 - 7) = 0.571.
Now, the overall distance to the frontier just averages the two distance measures for each person. So Alice’s overall distance to the frontier is (1 + 0.714)/2 = 0.857. Bob’s distance is (0 + .571)/2 = 0.286. Let’s say we plot their GDP per capita against the “Doing Fruit” index and find a positive relationship. We could publish this as an op-ed in the Fruit Growers News, and argue for policy changes in the number of apples and oranges to boost living standards.
But does that relationship actually mean anything? Not really. What happens to the “Doing Fruit” index, and presumably to GDP per capita, if the following happen?
- Bob raises his apple count to 9. Nothing happens. You can go figure it out if you want, but so long as Bob has fewer apples than Alice, his number defines the lower bound, and hence he is always at the lower bound, which means he always gets a zero in apples. Bob had a reform but didn’t change his “Doing Fruit” distance to the frontier. Does this mean Bob’s reform wouldn’t raise GDP per capita?
- Alice lowers her apple count to 9. Nothing happens. Similar reasoning as above. She defines the top end, so lowering her apple total doesn’t change her distance to the frontier. She is the frontier. Does this mean that Alice could lower her apple total without affecting GDP per capita?
- The WB raises the lower bound on oranges to 2. Alice’s index drops to 0.8, Bob’s drops to 0.2. So according to the WB, they both just got farther from the frontier, even though all we changed was the arbitrary lower limit to oranges. Do they both get poorer?
- Introduce a new person. If Charlie, with only 2 apples but 7 oranges, joins the party, then Bob’s “Doing Fruit” index rises to 0.473, because he’s now above the lower limit in apples. Nice job, Bob! Does Bob’s GDP per capita go up in response, even though nothing changed in Bob’s fruit totals?
- The 3-body Problem. With Charlie involved, Alice has an 0.857, Bob an 0.473, and Charlie an 0.500. If Alice’s number of apples falls to 8, then we get Alice with an 0.857 (again), Bob with a 0.535, and Charlie with a 0.500. So by changing Alice’s frontier total of apples we just made Bob look better. So good, in fact, that he has now passed Charlie. The decline in Alice’s apple total leaves her own GDP per capita unaffected, but makes Bob richer than Charlie?
- Marginal fruit changes. With Charlie involved, what happens if Bob raises his apple total by 1? His DF index goes up by 0.062, and presumably he gets richer because of this reform. If he raises his orange total by 1, his DF goes up by 0.071, and thus increasing oranges is better for GDP per capita than increasing apples. Oh, unless Charlie happens to have 4 apples, in which case it totally is better to increase apples than oranges on the margin.
I could go on, but I think I’ve made the point. Adding up across indicators like apples and oranges results in indices that have no meaning. With sufficient time, I could come up with my own abitrary reweighting of the individual components of the Doing Business indicators and make the relationship between the index and GDP per capita go to zero, or go to infinity.
Without the means of valuing the different business indicators against each other, we end up having no idea how to assess institutional changes. For example, within the “Dealing with Construction Permits” section of the DB indicators, there is both a measure of the time (days) to get a construction permit and a “Building quality control index” which is an arbitrary classification that runs from 0-15 (in whole numbers).
Going up one category in quality control (e.g, from 9 to 10) increases your overall “Dealing with Construction Permits” score by 0.067 (i.e. 1/15th). By construction, this has an identical effect on your overall score as lowering the number of days to register a permit by 23 days (actually, 23.13 days). From the perspective of a business owner, do we think that dropping the days to permit a building by 23 is exactly equivalent to raising the quality control index by 1? Should I believe they would have identical effects on GDP per capita?
And what is this quality control index anyway? It’s the sum of a bunch of roughly binary indicators. So going from 9 to 10 could represent having a licensed engineer be required to review the plans (yes, that makes doing business easier in this index). Or it could be because construction companies become legally liable for structural flaws. Or it could be because construction supervisors are now required to have university degrees. These (and a host of other things) all contribute identically to the “Building quality control index”. But are they all equally worthwhile to doing business? Are they even good for doing business? Should I believe they all contribute similarly to raising GDP per capita - if they even do?
The point is that all the curve-fitting in the world won’t change the fact that the Doing Business index contains effectively no information. The individual indicators themselves can be useful, but as an aggregate it doesn’t make sense.
It Gets Worse
In the follow up post, Cochrane appeals to a graph from my textbook with Chad Jones. An updated version using data from 2008 shows the relationship of an index of “social infrastructure” and TFP.
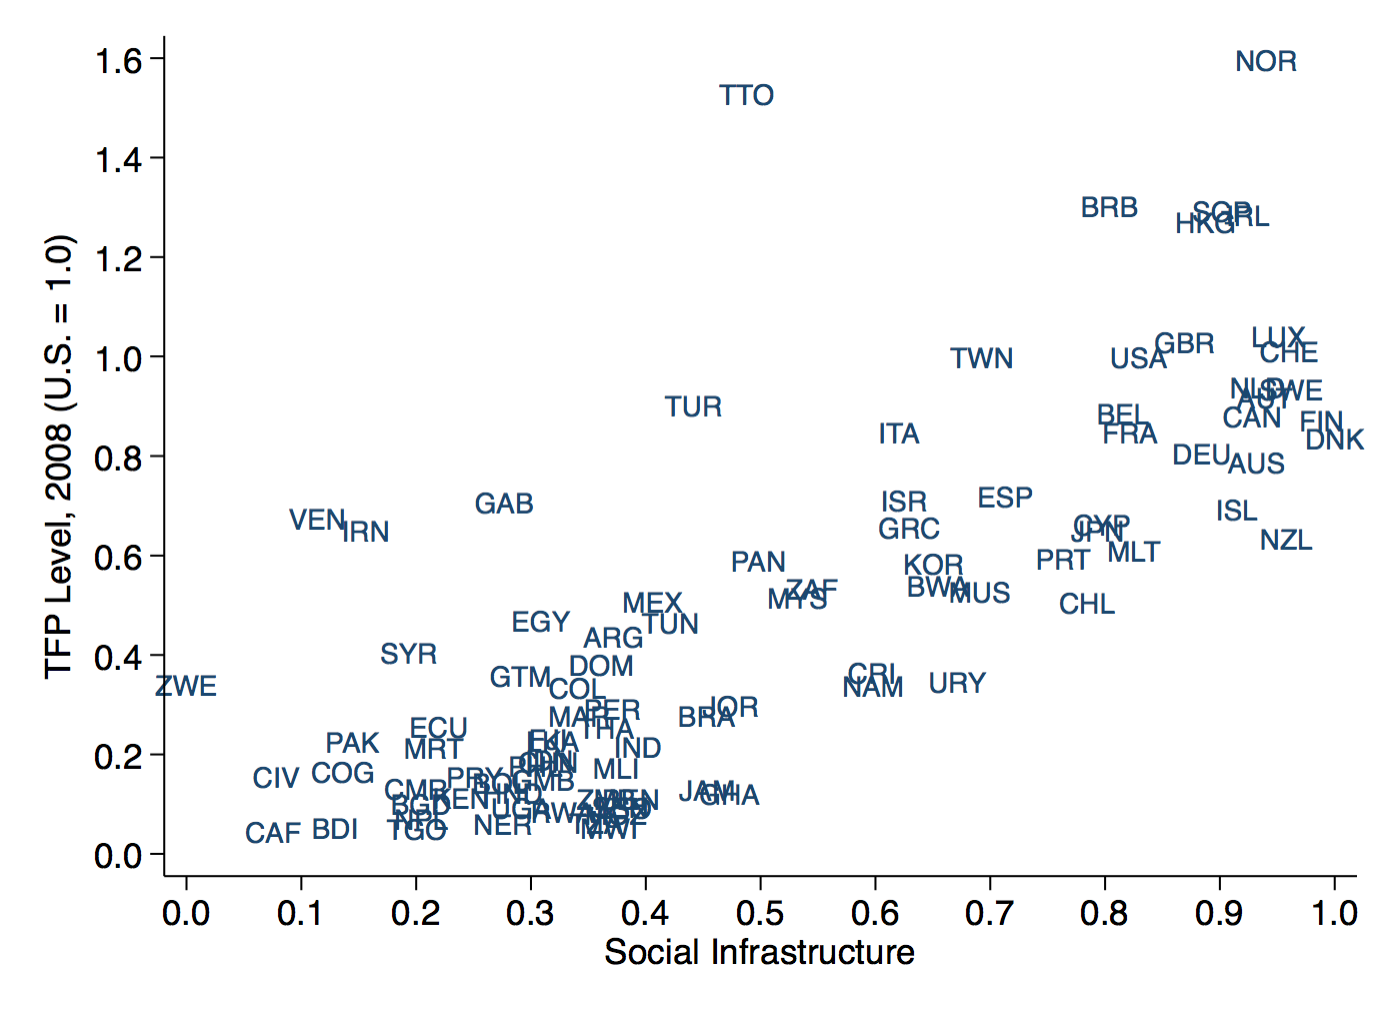
This index of “social infrastructure” is even more useless than the DB index. How do I know? Because I calculated it, graphed it, and stuck it on the slide that Cochrane linked to. I simply scaled and averaged the 6 different components of the World Bank’s governance indicators, much like the DB index. It has all the issues I described above, except worse.
This figure tells us very little. Which is why in the book we immediately say that you cannot infer anything causal from it, and then go on to talk about some of the better studies done looking at specific institutions and their effects on economic outcomes.
Short-Run Growth versus Long-Run Growth
Let’s concede the issues - barring the “go to 11” one - to Cochrane; there really is a causal relationship between the DB index and GDP per capita, and his original fitted curve is the right one. Does it follow that we could get 6% growth, as Cochrane suggests here?
A score of 100—labeled Frontier—is certainly possible… [and] generates $163,000 of income per capita, 209% better than the U.S., or 6% additional annual growth for 20 years
No. Why? We’ve been through this before on this blog. I’ll let you jump to that post to see the exact math. Assume a baseline growth rate of GDP per capita of 1.0% per year, a convergence speed of 2% (meaning 2% of any gap between current and potential GDP is closed each period), and that potential GDP per capita really does go up by 209%. This would result in growth of 5.2% in 2017. That’s pretty good, but below Cochrane’s 6%. And the growth rate would decline in every year after 2017 until it reached 1% again. Technically that would take until infinity; practically you wouldn’t be able to tell the difference after about 50 years.
This is like the dark side of compounding. It only takes small changes in percentage growth rates to generate really big changes in levels of GDP over a sufficiently long time. Convergence is slow. Even a massive shock to potential GDP doesn’t boost growth that much.
Why do I assert that it takes so long to reach potential GDP (i.e. why is the convergence speed 2%)? First, that’s what we estimate from the data. Second, the adjustment costs to a significant change in the rules and regulations underlying the DB indicators mean that it could take a long time to reach the new potential GDP.
Let’s say that boosting our DB index to 100 really is a fundamental reduction in regulatory red tape. This is like a productivity increase in compliance and government. We can generate the same “output” of regulation with far fewer people. So all those private employees who do compliance work are not necessary, nor are the public employees who check their work. This work may be bullshit, unnecessary, and fundamentally useless - but those people make a living doing it. They are like redundant assembly line workers after the introduction of a robot. They won’t seamlessly melt back into the workforce. What’s a 50-year old safety professional specializing in OSHA compliance for a construction company supposed to do when he gets let go? As we’ve seen before as industries get destroyed, it can take a long time for ex-workers to adapt, if they ever do. That adaptation of the human capital stock is part of the slow convergence speed.
And recall that many of the characteristics that would boost your DB index score - like the requirements on construction inspections and the education requirements for those inspectors - in fact involve more regulation and time spent on compliance, not less. So should I even believe that these changes are positive for potential GDP at all?
Does it matter?
After all that, be careful not to draw the opposite conclusion, which is that business regulations do not matter at all. That’s not what I’m saying, and not what the criticisms of Cochrane imply. The point is that we cannot infer how much they matter from the DB index, or a cross-sectional plot of that against GDP per capita. And forecasting the effect of improving the DB index - seriously, 11? - is a lost cause.
For a country like the US, the marginal effect of regulatory changes are almost certainly mild. Not zero. Not negative. But probably small. We have no good evidence of effects large enough to really move the GDP growth needle.
It isn’t even clear we are really behind the frontier in business regulation. Singapore is held out as an example of a place with a great business environment, and is one of the data points suggesting that having a high DB index is associated with high GDP per captia. But Singapore has high GDP per capita in large part because it is just a single city.
If you compare single US cities to Singapore, they look just fine, if not better. Brookings did a ranking of cities by 2014 GDP per capita. Singapore is 14th, with a (PPP-adjusted) GDP per capita of 66,684. But Hartford is at 83K, San Jose at 82K, Boston at 76K, Houston at 74K, Bridgeport at 73K, Washington at 73K, Seattle at 73K, San Francisco at 72K, and New York at 69K. There isn’t some kind of low-regulation Utopia out there that we are missing out on.