The fact that economic growth has slowed in the last few decades is not news, at least not on this blog. And I’ve been through a series of possible explanations over the course of the last few years. One bit of data that I played around with a few years ago was the decline in the growth rate of capital per worker. In this post I looked at some figures using BLS data that showed the amount of capital per worker was declining in 2010-2013. That was unprecedented, as even during recessions in the past it was the case that capital per worker kept growing.
A new working paper by German Gutierrez and Thomas Philippon (GP) has taken on this same topic, only in much more detail, and with a lot of effort put into understanding why investment has been low recently. Moreover, they document that investment by firms has been falling over a longer period of time, coincident in large part with the productivity slowdown of the 21st century.
Investment is lower than you’d expect given profits
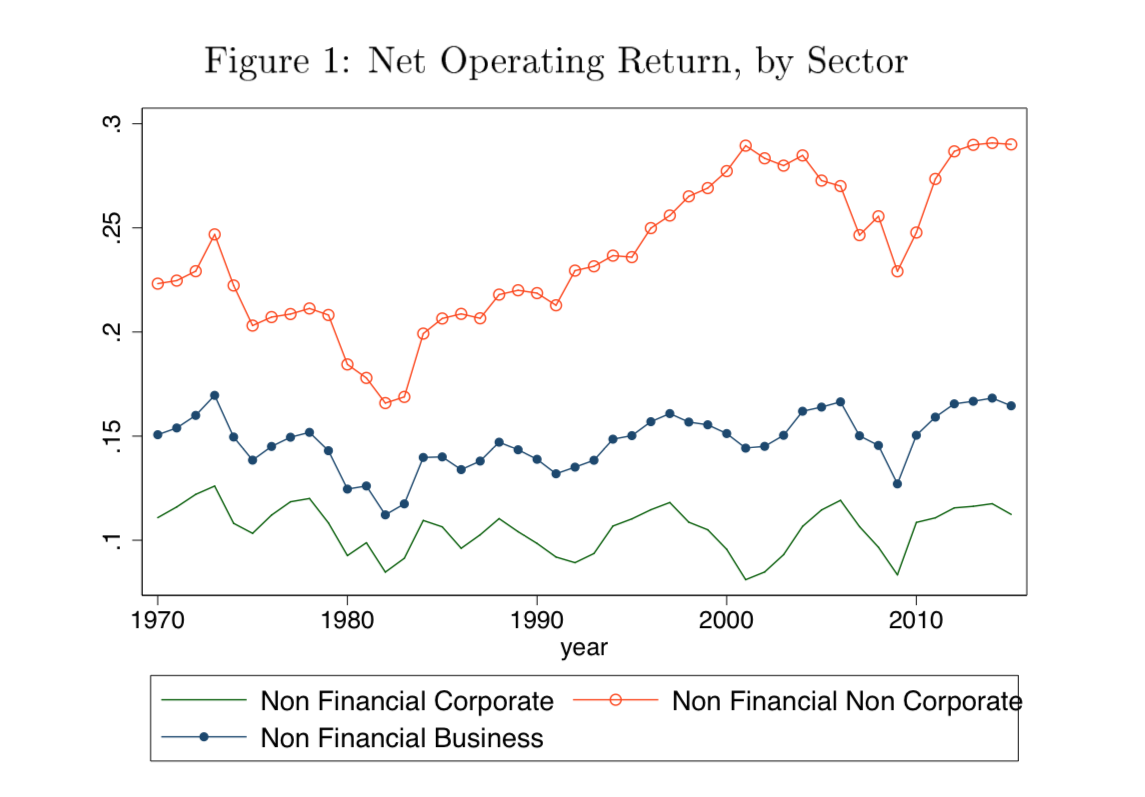
GP start by documenting that firms remain profitable over time, but that their investments are declining over time. This first figure shows the net operating return on capital for non-financial firms (which do the bulk of non-residential investment). “Business” here is the umbrella covering both corporate and non-corporate firms. What is apaprent from GP’s first figure is that the net operating return on capital has remained constant, or grown, over time. For corporations, it is about 10% throughout this period, while for non-corporate firms it has gone up from about 20% to almost 30%. So the decline in investment by firms is not because they are unprofitable. Even the financial crisis in 2009 only produces a slight dip in the net operating returns.
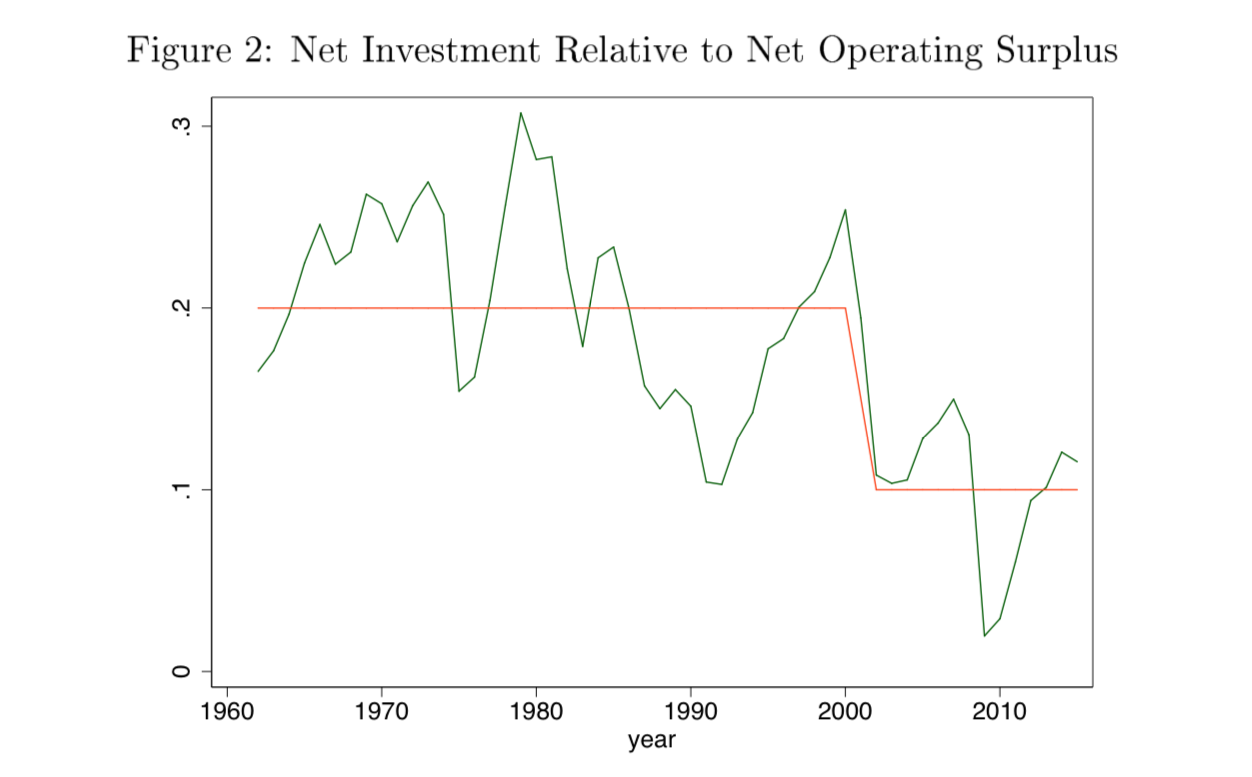
The second figure shows the crux of the story in GP. Net investment (investment spending minus deprecation) relative to net operating surplus appears to have shifted down after 2000. Prior to that, net investment averaged roughly 20% of net operating surplus, while afterwards it averaged only about 10%. I’m not sure how hard to think about the spike in this ratio in the 1990’s - this may be a temporary thing driven by the same technology surge that appears to have driven productivity growth - but you might be able to argue that the average net investment rate got down to 10% as early as 1990. Regardless, it is clear that the investment rate out of operating surplus fell, and stayed low, in the 2000’s. This, derived from more finely-grained data, is the equivalent of what I was talking about in my post from a few years ago.
Now, as GP point out, it is not the case that we should expect this ratio of net investment to net operating surplus to be constant over time. Firms are (presumably) optimizing their investment behavior to maximize profits, and based on changing conditions it might make sense to invest more or less of their net operating surplus. What GP work through is a standard model of firm behavior, and link net investment to Tobin’s Q. This metric is, roughly, the market value of a firm relative to the replacement cost of its capital. If Q is more than 1, then the firm should be investing enough to increase its capital stock, because market value they get from having capital is more than what it costs to install it. If Q is less than one, the firm should let its capital stock run down (allow depreciation to outweigh investment) as the they are not generating as much market value with their capital as they would pay to replace it.

One explanation, then, for the decline in net investment relative to net operating surplus is just that Tobin’s Q fell. And Tobin’s Q would fall if people expected particularly low future earnings (and hence gave firms lower market values) or if the replacement cost of capital was rising. But as GP show, Q wasn’t falling. It was rising, at least for corporate firms. The two measures of Q differ by how exactly GP calculate it, as it isn’t obvious how to treat a set of miscellaneous assets and liabilities at firms in order to come up with the market value part of the Q ratio. Regardless, however Q is measured, it is now relatively high compared to the 1980’s, and only lags the very high values seen in the late 1990’s.
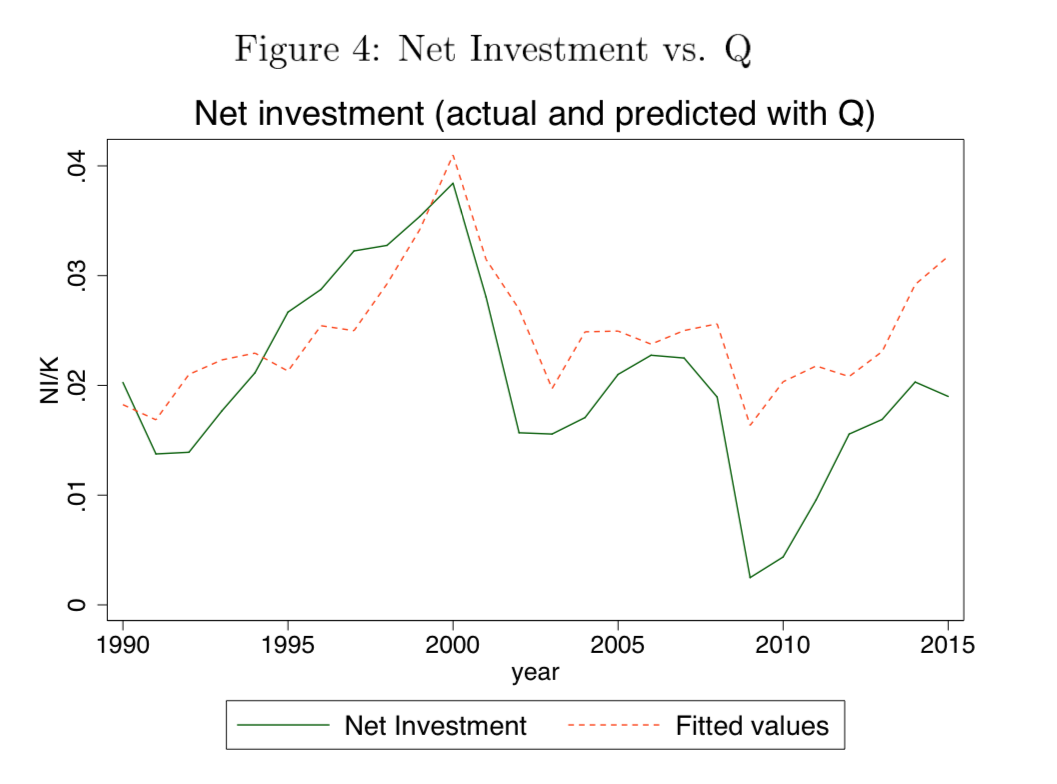
GP then use the data on investment rates and Q from 1990 to 2001 to get a baseline relationship of the two. Given that relationship, they look at what the net investment rate would have been given the Q values we had in the 2000’s, if investment had continued to follow that 1990-2001 relationship. In the above figure, this is plotted as the orange dashed line. Compared to that is the solid green line, which is the actual net investment rate. You can see that starting in 2000 the observed investment rate is always below the predicted investment rate, and sometimes by substantial amounts. Based on this, GP conclude that firms are under-investing compared to how they used to. This, despite the fact that they are profitable.
Blame it on concentration and institutional ownership
Okay, so why are firms investing less given their Q ratio and profitability? GP go through an extensive list of possible explanations, which I will not repeat here. Let me jump ahead to the two explanations that hold up across all of their analysis: concentration and institutional ownership. Before I get on to that, let me say that their analysis consists of regressions of net investment rates at either aggregate, industry, or firm level on various sets of control variables. In each case, they control for Q itself, to capture the natural fluctuations in net investment rates. The other control variables are there to see if they are significantly correlated with net investment rates. GP have a companion paper which does more work trying to see if those significant correlations are in fact causal. For the time being, let’s just hang in there with the correlations.
Across all these regressions, what keeps showing up is a significant correlation between net investment rates and measures of concentration and measures of institutional ownership, while other possible correlations are insignificant or disappear once you control for other variables.
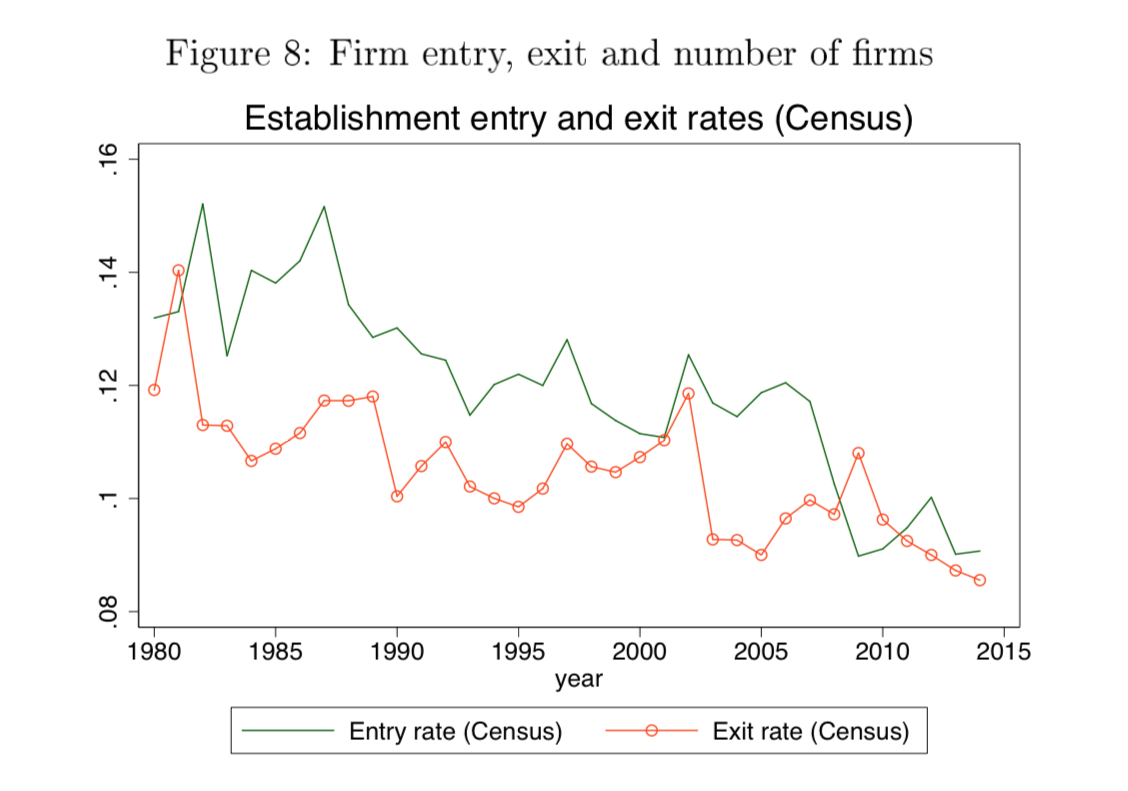
For concentration, what GP mean is fewer firms within small sub-industries, implying that each remaining firm has possibly more market power. At the aggregate level, the following figure shows that the rate of firm entry and exit has declined over time, consistent with all the evidence that the John Haltiwanger-led posse of researchers has been banging on for several years. Less entry means fewer new competitors entering, and less exit means fewer firms are being forced out of business. This is consistent with higher concentration.
Why would concentration limit investment? The simple intuition is that if you don’t have to worry about competing with anyone, why bother to blow any money investing in a better product? Think of a cable company (cough Comcast cough) which has a monopoly in a local market. What incentive do they have to either upgrade their technology to make it more reliable or faster, and what incentive do they have to invest in, say, more repair vans and extra technicians? None, because they know you can’t go anywhere. Be careful to not run too far in the other direction, however. If firms have zero market power, they also will have no incentive to invest, because any advantage they get will be immediately competed away. Somewhere in there is some kind of market power/concentration level that maximizes firms incentives to invest (and innovate, by the way). GP’s results suggest we are on the “back side” of the curve, and increasing concentration is leading to less investment (i.e. more Comcasts) rather than creating incentives for firms to invest.
The second significant correlation GP find is with institutional ownership of firms, which can include mutual funds and pension funds. Since 1980, these institutional investors have taken on larger and larger stakes in corporations, to the point that the average firm has about 60% ownership by institutions as opposed to individuals. I’ll admit to not being quite clear on what a “transient” institution means, but the “quasi-indexers” are things like actual index funds as well as widely-diversified mutual funds.
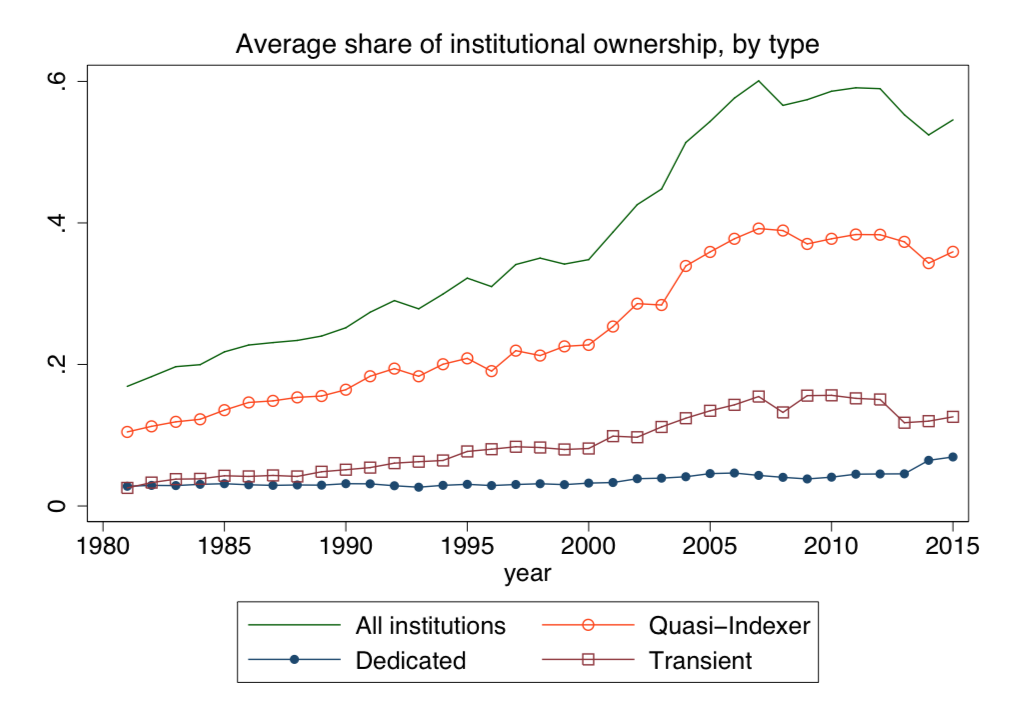
As the share of quasi-indexers rises, GP find, the rate of net investment falls. Now, you can tell yourself a lot of stories about this, both good and bad. The bad is that quasi-indexers are pushing firms to think only about short-term ((e.g. quarterly) results, and as such firms are loath to spend on long-term investments. The good is that quasi-indexers are pushing management to be more thoughtful about exactly what they invest in, which would imply that the high rates of net investment before were probably too high. It isn’t obvious which one of those interpretations is correct, on the face of it. The prima facie evidence would be that the growth rate of GDP has fallen in the same period in which the net investment rate has fallen, suggesting the bad interpretation is correct. But there could be other forces at work that kept the growth rate high in the 1980’s, even though the net investment rate was too high. So don’t pull out the torches and pitchforks just yet.

Whatever the intepretation of the institutional ownership, what GP do document is that share buybacks have climbed over this period. Mechanically, spending more on doing share buybacks means less money left over for net investment. It appears that firms, since the early 1980’s, have been using more of their net operating surplus to buy back existing shares (driving up the market value for existing owners) and less on investment. The total payouts/assets in this last figure include buybacks and dividends, and after 1982 you can see that the trend upward in total payouts/assets is driven by an increase in buybacks. GP note in the figure 1982 as an important point because this is when the SEC passed a rule (10b-18) allowing companies to repurchase their own shares on the open market without any regulatory limit. Prior to that, there were restrictions on how much they could repurchase.
For a major shareholder of a firm, you can think of two major ways of making money off your holding. First, you could pursue long-term investments to grow the business and/or expand your market. This would raise the value of your shares by increasing the assets of the firm. Second, you could get the firm to buy back existing shares, driving up their price, and the value of your shares would increase proportionately. This second strategy is faster (you don’t need to wait to install the capital) and arguably less risky, because you don’t have to make a commitment to a new plant or location that may or may not prove to be profitable. Of course, you could go back and argue again that firms were over-investing in the past, and that the buybacks allow those shareholder who were bought out to reinvest their money in higher-return projects. Again, the prima facie evidence is working against you here, but that doesn’t mean you’re wrong.
One last note here is that GP look separately at the effect of concentration and institutional ownership on capital expenditures (e.g. physical equipment) and R&D spending. Higher concentration and more institutional ownership are correlated with lower rates of spending on both. The decline in investment they document is not just for physical equipment (which perhaps one could argue is becoming less relevant for production) but also for R&D (which one could not argue is becoming less relevant).
Does it really matter for growth?
The last section of GP covers the implications of this for growth. I’m not going to go through their work in detail, as they are trying to line it up with some work by Fernald, Hall, Stock, and Watson, and that gets more complicated than I want to cover in a blog post.
But GP do sneak in an interesting point in their discussion about the importance of falling investment for growth. If we think that the underlying growth rate of productivity has fallen, which is what appears in the data regarding productivity growth, then this implies that the long-run capital/output ratio should rise. For those of you who grok the Solow model, the capital/output ratio is $K/Y = s/(n+\delta+g)$ in steady state. Lower g, higher K/Y ratio. Except that we do not see a higher K/Y ratio over time. It has remained relatively constant, even as the trend growth rate of productivity has fallen. So something else must be going on, and one possibility is that “s” has fallen. In the Solow model, that “s” is the share of output that is turned into investment goods (“saved”) every period. Consistent with the GP story, if s has fallen at the same time g has fallen, then the K/Y ratio will remain roughly constant.
What this means is that the growth rate of GDP gets pulled down even more than it would be through just the decline in g. If s stayed constant, then the drop in g would lower the growth rate of GDP, but the increase in the K/Y ratio would offset that by a little. With the coincident drop in s, we don’t get that offset, and so the effect of the drop in g is particularly pronounced. GP speculate that increased market power of firms can explain why s dropped at the same time as g. That story is consistent with the data that is accumulating, for sure. I have not worked through their companion paper on causality in detail yet, so I can’t offer any opinion on whether increased concentration or market power appears to cause the decline in s. For now, let’s leave it out there as a very plausible story for what has occurred. Whatever the causality, their initial evidence is clear that there has been a decline in net investment, and that warrants attention if we’re trying to account for why the growth rate of GDP has fallen over the last few decades.