A quick aside before I start the main part of the post. My blogging has been sparse in the last few months, or even year. This was in large part a reaction to working on a book about the growth slowdown, and time that would have gone into posts got poured into that book. Topics that I would have addressed in posts here got folded into the text of that book. As a few days ago, I’ve got a contract to publish that with the U. of Chicago Press, and it should come out in 2019. There is still some revising to do, but at this point I should get back to some more regular blogging, as I’m out of the weeds on getting the book drafted. Famous last words, of course.
Back to actual posting. One of the very early posts on this blog, back in 2014, asked “Is Robert Gordon right about U.S. growth?”. Gordon had written a few pieces explaining that, as of 2007, the trend growth rate of GDP per capita in the U.S. was 0.9%. That is just under half of the trend growth rate that held through most of the 20th century and up to 2007, roughly 2% per year.
What I did in that post was point out that it would take several years to accumulate enough evidence to reject the hypothesis (in a statistical sense) that the growth rate was still 2%. The issue is that there are fluctuations in GDP per capita around trend (e.g. recessions, booms), and thus it was possible that GDP per capita could still have a 2% trend growth rate, yet GDP per capita could grow quite slowly for a few years due to the effects of the financial crisis or other fluctuations.
One of the things I came up with in that post was that it would be 2018 before we could make some concrete statements about whether the trend growth rate had fallen below 2%. I really should wait until next year when the data from 2018 are available, but nevertheless it seemed interesting to revisit this question now that we’ve got more evidence on GDP per capita from the last few years.
But in evaluating whether trend growth has dropped below 2% it turns out to be important to distinguish between changes in the growth rate and changes in the level of GDP per capita. The distinction of the level and growth rate is similar to the distinction between the lane you are in on a highway, and your forward speed. Your forward speed could be identical in either lane in the long run, but if you change lanes (i.e. there is a level shift) your forward speed (i.e. the growth rate) will drop for a few moments as you transfer some of that into moving sideways. And we don’t want to use the temporary drop in forward speed from changing lanes to make an inference about your long-run forward speed.
In this setting, we could think of two versions of Gordon’s hypothesis. The first is that the growth rate changed in 2007, but there was no level shift. That is like saying that you stayed in the same lane, but the car slowed down. The second is that there was a level shift in 2007 - you changed lanes - and that the car slowed down once you got into the new lane. It will be much easier to detect the change in speed in the first situation than in the second.
By the way, I’m calling this “Gordon’s hypothesis”, but the general idea that the trend growth rate has dropped is not a unique prediction of his, and is probably the default hypothesis for most people who pay attention to the economy. He just put a specific number on the drop, so it makes his prediction more tangible.
A simple drop in the growth rate
Look at the first version of Gordon’s argument, that the growth rate dropped in 2007, but there was no level shift. Taking that as the alternative, I did some very crude calculations in the original post asking when it might be plausible to reject the hypothesis that trend growth was still 2%. The intuition of those calculations was that if trend growth was in fact 0.9% - if we had slowed down - then eventually GDP per capita would fall so far below the 2% trend that we’d have to reject that growth was still 2%. At some point in time it wouldn’t be plausible anymore that all we were seeing were some fluctuation that took us below trend.

The figure tries to give you some visual for this situation. The solid black line represents the old trend line, estimated using data from 1950 to 2007 (the actual growth rate of this is about 2.1%). The gray lines above and below that 2% trend line are the error bands, meaning that if GDP per capita were in that range, we couldn’t reject that 2% trend growth was accurate. What you also see is the dashed black line representing 0.9% growth starting in 2007, Gordon’s hypothesis. And again, there are gray error bands around this showing where we might expect GDP per capita to be if 0.9% growth was true.
Finally, you can see the thick black line tracking actual GDP per capita. The financial crisis in 2009 drops the economy below all the error bands, which just represents how dramatic the crisis was relative to the normal fluctuations we might expect in GDP per capita. Since 2009, GDP per capita continued to track upward, but not very rapidly. What seems to be clear from this figure is that GDP per capita is well outside of the 2% error bands, and has been for several years. From this we should reject 2% trend growth.
Does that mean Gordon is right? In favor of the 0.9% hypothesis is that GDP per capita falls within the error bands of that trend. Which means we cannot reject 0.9% growth. But that is different than saying 0.9% is right. We also cannot reject 1% growth, or 0.7% growth. Nevertheless, whether we want to buy Gordon’s precise 0.9% alternative, it would appear that the old trend line no longer applies. We’re just too far out of range.
Separating trend growth and trend level
But before we dispense with 2% trend growth, we need to think about the distinction of the growth rate and the level. It is quite possible that the financial crisis shifted the level of GDP per capita down, but that the growth rate of GDP per capita remained around 2% on trend.
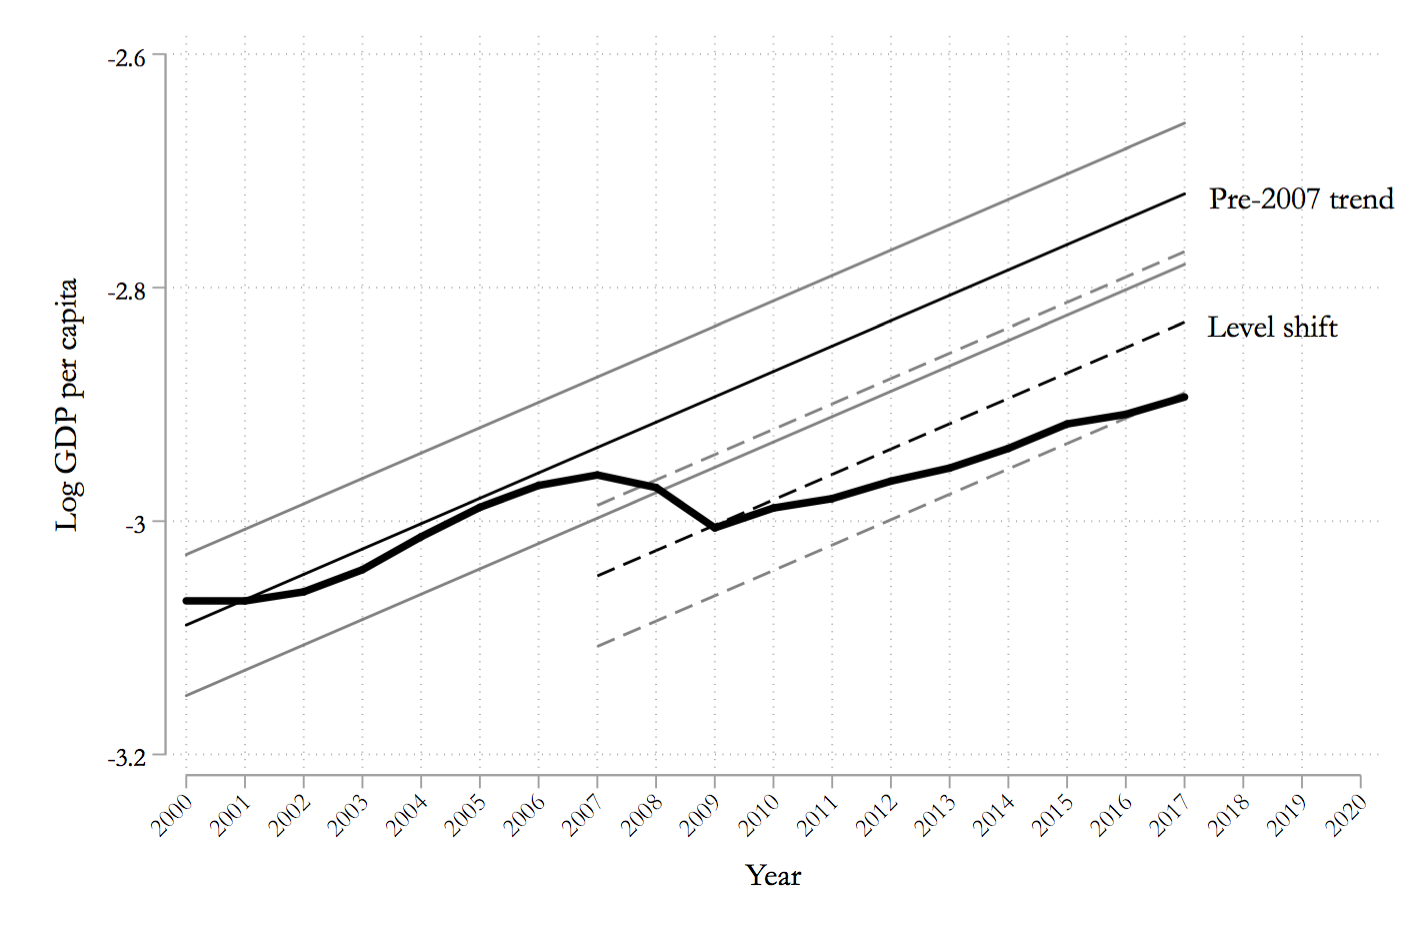
To see what I mean, take a look at this next figure. Here, what I’ve done is show what a simple level shift - a lane change - looks like for the economy that keeps the 2% trend growth rate. I eyeballed the level shift so that the financial crisis set the new level. But given that new lower level, the growth rate stays the same, and so the dashed lines show the trend and error bands we could expect for GDP per capita after the shift.
Here, it is less obvious that we can reject a trend 2% growth rate. The actual path of GDP per capita is still within the error bands of 2% growth given the new level. We are just about to scrape outside of those error bands, so within the next year or so, barring an economic miracle, you’d probably reject 2% growth even if you believed there was a level shift after the financial crisis. But we’re not quite there yet.
And again, even if next year we decide that we can reject a trend 2% growth rate, that is different from accepting that growth is 0.9%. All we’ll know is that it isn’t 2%. It might be 1.7%, or 1.5%, or something else. But even if we can’t say that Gordon’s prediction is right precisely, we could certainly say that he is right that the trend growth rate is lower than it was prior to 2007.
Long run implications
The distinction I’m making here between the two situations may seem overblown. Regardless of the scenario, we definitely seem to be below the old trend line. True, but the implications of the two scenarios for the future are very different. If we really are going to experience 0.9 or 1% growth for the indefinite future, that is far worse than experiencing a level shift in GDP per capita followed by continued 2% growth (or something like 1.5% growth). Compounding always wins.
Go back to 2007, and start there. Now extrapolate out different scenarios to 2040. On the old trend line, GDP per capita in 2040 would be almost exactly 2 times (98%) higher than in 2007. If starting in 2007 the trend growth rate dropped to 0.9%, then GDP per capita in 2040 would be only 35% higher than in 2007.
If there was a level shift after 2007 that lowered the trend line by 9% (what I drew in the figure), but the growth rate remained at 2%, then in 2040 GDP per capita would be 81% higher than in 2007. That’s much better than in the situation with the lower growth rate. And even if there is a level shift and the growth rate drops to 1.5%, we’d still have GDP per capita in 2040 48% higher than in 2007. Still better off than if the growth rate dropped to 0.9% per year.
The point is that you don’t want to confuse the scenarios with growth changes and level shifts. These have very distinct implications for the future. And the available evidence on GDP per capita doesn’t tell us which of these scenarios is right, and which is wrong. All we know is that we can reject the old 2% trend line, but we’ll need more evidence before we can figure out whether we saw a drop to a lower growth rate only, or a level shift and possible drop int he growth rate.