If you’re wondering what I’m attempting to do in these posts, then join the club. I’m just sort of grasping around for a way of thinking about the aggregate impacts of the shutdowns that takes into account the fact that it will hit particular industries directly (e.g. restaurants) but that this will have ripple effects on other sectors. The prior posts (here, here) were building up some understanding of a baseline model to do this.
The big problem with the baseline model is the fact that it assumes a lot of flexibility in the economy, especially in terms of labor moving around between industries in response to productivity or demand shocks. We’re not seeing the kind of perfect flexibility the baseline model assumes. We are seeing some flexibility, as Amazon, Costco, and other firms are hiring even as many industries are laying people off. But there is nowhere close to enough of this new hiring to offset the massive job losses that have occurred. We’re at 10 million UI claims in the last two weeks as of today.
Like a lot of macro models, the baseline version I started with is useful for thinking about relatively long-run changes when the frictions (search and match, for example) have had time to work themselves out. But I think I can still leverage this baseline model to get some idea of the short-run impacts by ignoring some of it and then making some simplifying assumptions of my own.
The industries
To explain, let me start with the input/output structure. I’m going to play around with fifteen industries (okay, 17, but the last two are tiny and mainly there so that things add up). I could do this for 71 or (God forbid) 405 industries using I/O tables provided by the BEA, but this is sufficient to get the idea and calculate some effects.
You can see the 15 main industries and some summary information in the following figure. Yes, that’s just a clip from a spreadsheet, which you can find here if you want to play with it. This data is all from 2018 - I know, I know - but that is the latest version of the full I/O tables you can get. For my purpose of seeing how things spread around the economy, I’m okay with that. I’m not trying to give you a precise estimate of GDP in the 2nd quarter of 2020.
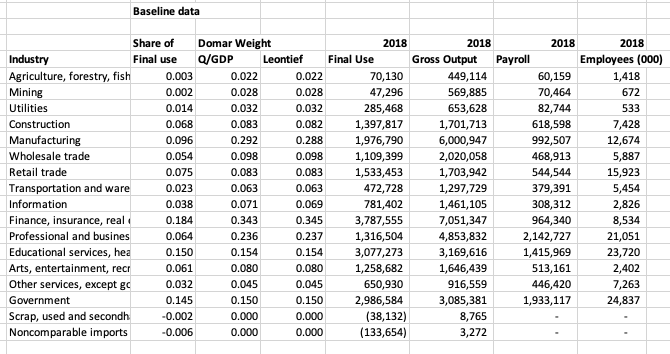
The first column shows the share of “final use”, which is another way of referring to GDP. Final use of an industry’s output is that output which is not used as an intermediate good by some other industry. The sum of final use across industries adds up to GDP. Agriculture constitutes 0.3% of GDP, and manufacturing is 9.6%, for example.
The second and third columns show the Domar weight for each industry, which I explained in the prior post. It’s calculated twice as a check on myself. Once calculated the normal way, by dividing gross output of an industry (Q) by GDP. The second time is calculated by using the I/O matrix itself, and this was just to make sure I wasn’t making some mistake with that matrix. If you take a look at the Domar weights, you can see which industries have a lot of connections as suppliers to other industries. Manufacturing, for example, has a Domar weight of 29.2% even though it is only 9.6% of GDP. That is because manufacturing produces a lot of output that is used as intermediates by other industries, so its influence on the economy outweighs its final use. Retail, on the other hand, has a Domar weight of 8.3% compared to a share of GDP of 7.5%, not much different. That is because retail isn’t used much as an input by other industries.
Following that you can see the total final use and gross output of each industry. And next to those in the final columns are the payroll of each industry (labor compensation as reported in the I/O accounts) and the number of employees (in thousands, which I pulled from a different BEA account).
The shock
I said I was going to ignore some of the baseline model in order to make sense of the current shock. I’m going to shove through an exogenous drop in final use spending on a few industries (e.g. art, entertainment, and food service) and then ignore that in the baseline model this spending would end up being done on other industries. In the baseline model there is no place for consumers money to go other than spending on final use goods or services from the industries. So if you spend less on food service, you would spend that money in the retail industry, for example.
What I’m doing is assuming that you can just not spend that money. I’m allowing people to have a bank account, or a mattress, or a shoebox, or whatever, and to just stop spending as much. If people spend less on goods and services, GDP will shrink. This is all pretty old school Keynsian cross stuff. And for the purposes of evaluating the effect of a massive spending shock over the horizon of a couple of weeks, I’m good with that. We’re well within the window of time when it makes sense that things like relative prices, wages, and labor allocations across industries aren’t able to adjust. If you aren’t comfortable with that, I could also introduce a “household production” industry into the mix which people spend resources on, but which doesn’t get added up as part of GDP. The drop in spending on food service and other industries would be matched by an increase in “spending” on home production.
Either way, measured GDP will fall. What is more interesting to me here is the impact of these immediate spending shocks on the gross output of other industries. When we all spend less at restaurants and hotels, that impacts the industries they use like wholesalers, professional services, and finance. And that in turn impacts their suppliers, which in the restaurant example you might imagine includes the agricultural sector.
The gross output of each industry is going to be affected negatively by this spending shock, and the size of the negative effect is going to depend on how tied together they are by the I/O matrix. Without my Keynsian-like assumption, there would be some countervailing force propping up other industries as spending shifted from restaurants towards other areas. That could well be part of a response. We already see that some retail institutions (Amazon, some grocery stores) are seeing increased activity. You could play with that in the spreadsheet if you want.
The effect
I pushed some numbers through this, and the figure below shows what I’m getting. I assumed that spending on retail fell by 50%, on arts/entertainment/food service by 75%, and on other services by 75%. This is nothing other than gut feel. This is a back of the (very large) envelope stuff. The column showing these percent changes in outlined in red in the figure.
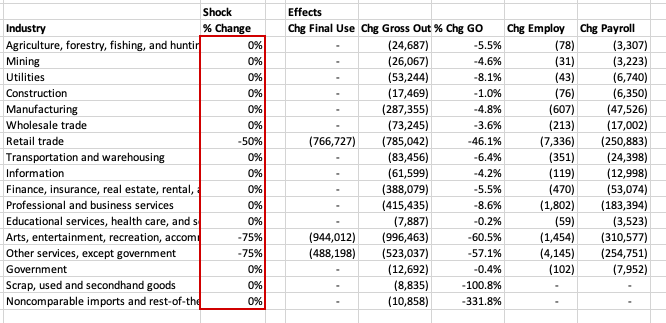
What follows are the implications. First comes the absolute change in final use spending in each industry. That’s 766 billion less in retail spending, 944 billion less on arts/ent/food, and 488 billion less on other services. Next comes the impact on all the industries due to this shock to final use spending. The “Chg Gross Output” column takes the spending shock and pushes it through the I/O matrix to figure out the impact on each industry due to the logic I explained above.
Gross output in agriculture falls by 24 billion, and in mining by 26 billion, for example. You get big effects in manufacturing, with a drop in 287 billion, in finance with a 388 billion hit, and in professional services with 415 billion. Also notice that in retail, arts/ent/food, and other services, the drop in gross output is bigger than just that from the drop in spending. The ripple effects from other industries come back to haunt them further.
Next to the absolute change in gross output is the percent change in each industry, giving you a better idea of the shock to each. No one really escapes here, except perhaps education/health, with only a drop of 0.2%. This small effect is due to the fact that education/health isn’t a big supplier of intermediate goods to other industries, and so lower demand for things like retail don’t really impact this industry much.
We can now get to the additional simplifying assumptions I am making to parse through the effects. First, I’m assuming that the share of industry gross output used on payrolls stays constant, as if the industry had a Cobb Douglas production function. This means that payrolls scale up and down with gross output, or that the percent change in total payroll in an industry is the same as the percent change in gross output. This is the last column in the above figure.
The second assumption is that within an industry the wage is sticky. If the wage is sticky, then any drop in payroll has to be accomplished by firing people. So the percent change in employment in an industry is also the same as the percent change in gross output. This is in the second to last column of the figure.
For retail, this implies a drop in employees of 7,336,000, and in arts/ent/food a drop of 1,454,000. Other services lose 4,145,000 workers. But note that professional services sees a substantial drop of 1,802,000, all because of the ripple effects of the initial spending shocks. There are hundreds of thousands of jobs lost in other industries like manufacturing and finance. None of these should be taken too seriously, as again I’m just doing back of the envelope stuff here.
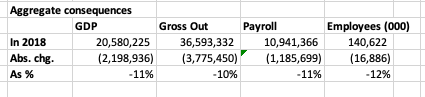
I can aggregate all this as well. The last figure here shows those aggregations. GDP falls by 11%, which is entirely due to the assumed collapse in final use spending in those three industries. There is nothing magic about getting that number, but I did choose the shocks to get something like this, as it jives with some reports about the size of the drop in GDP we might expect over the next few months. Gross output drops by 10%, in line with GDP, and payrolls by 11%, neither of which are surprising given the assumed drop in GDP.
Total employment in this scenario falls by 16,886,000, which is 12% of employment in 2018. That’s not something I was trying to hit, but it is line with reports that the unemployment rate could jump by something in that neighborhood. We’re already at 10 million UI claims, so the question may be whether the negative shocks I threw in the spreadsheet are large enough.
What you can play with in the spreadsheet are also stimulus scenarios. Be careful here. The stimulus involves very little spending on government services directly, but instead is mainly transfers by the government to others to spend on any industry they like. So don’t add a big percent increase in the “Government” final use line. Instead add a positive percent to industries you think people will spend UI benefits or the $1200 checks on.
Doing it right
I can’t emphasize enough that this is not some kind of calibrated forecast of what is going to happen in Q2 or Q3 of this year. It is solely an exercise in seeing how some kind of shocks will permeate throughout the entire economy, even if they are centered on only a handful of industries.
If you did want to do something more accurate, what else would you have to do? I can think of several important ones.
-
Expectations. It’s not like the pandemic is a secret, so people are presumably adjusting their spending on other industries in anticipation of the possible effects this year. For example, businesses may be lowering capex because they don’t think demand will materialize until end of this year. That would act like another spending shock to manufacturing or construction. Workers who are worried about getting laid off in the future will pull back on spending as well.
-
Payrolls and spending. I’m not enforcing any relationship between the drop in payrolls and the drop in spending. If my little exercise is the “through mid-April” forecast, then you have to think through how the drop in payrolls will influence spending across industries in the “mid-April to mid-May” period, and so on.
-
Relative price changes. I didn’t say it explicitly, but this little exercise assumes that the relative prices of industries don’t change. If retail locations slash prices to salvage something out of the next few weeks, then this may get people to substitute spending towards them. Although perhaps lockdowns prevent this from doing anything about it?
-
Industry substitutions. Similar to above, if relative prices change then industries may decide to spend more on cheaper intermediates and less of more expensive ones. That changes the I/O matrix. I’m assuming the matrix stays constant, or that the “recipe” each industry follows for production stays constant. That may not be a bad assumption for small shocks, but is probably wrong for large shocks like these.
A lot of things missing, as you can tell. The farther forward you want to forecast, the more things my simplistic model is going to get wrong. But I find the simplistic model useful just for thinking about the rough scale of the shocks occurring and how they influence the whole economy. We’re starting to see papers coming online that are doing more sophisticated macro modeling of the impact of the virus, which from my very brief scan of intros are taking at least some of these effects into account. Those will be helpful for thinking about how long the dip will last and how significant the rebound will be, which my little spreadsheet has zero information about.
Stay safe. Stay home. Wash your hands. And you should probably wear a mask.