Well, after a massive break from most social media and this blog, I am stretching my neck back out of the shell. This first post back is very much a “teaching post”, in that it’s a rough draft of how I might talk about this topic in a class. I have some ideas for more topical posts to come, but for the moment this is helping to limber up the old blogging muscles.
Back in April Thomas Philippon released a working paper on additive growth. It takes on a common stylized fact in economic growth - constant exponential growth - and shows that there is a better option - constant additive growth. In words, the addition to productivity (TFP) is roughly the same every year over decades, and the growth rate of TFP is steadily declining.
The main result is very easy to see. The figure below shows the actual time path of TFP from 1948 to 2019 (labelled TFPNQ in the dark solid line). “Model G” is the implied path of TFP with exponential growth estimated using growth from 1948 to 1983 (small blue dashes). As you can see, that estimate wildly overestimates TFP levels by 2019, and hence implies that there was some kind of slowdown.
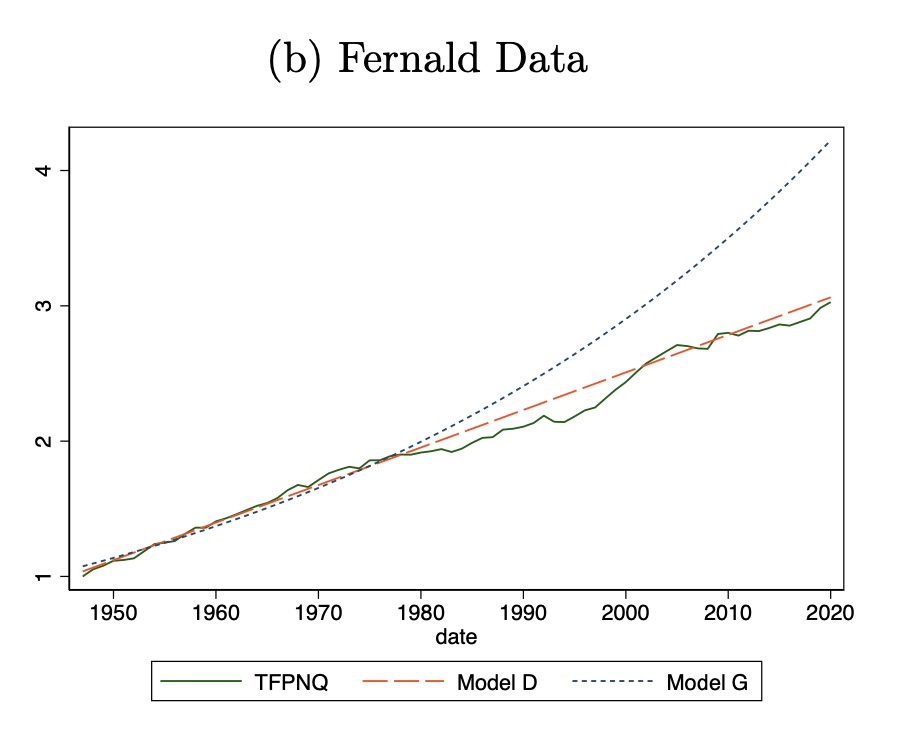
“Model D” is the implied path of TFP with additive growth (orange dashes), also estimated using the data from 1948 to 1983. This tracks the actual path of TFP much better. On the basis of the additive growth projection, there was no slowdown. That is, productivity in 2019 was exactly what an additive growth model would have predicted.
What follows in the paper is a series of variations on this to assure the reader that this overall finding is robust. This includes applying the same kind of methodology to other countries, with the result that all of them also present the characteristics of additive growth.
There is nothing in the paper that proves additive growth is correct and exponential growth is incorrect. That’s not a slight on the paper. It’s not possible to say exactly what the right model of growth should be. It’s plausible that despite Philippon’s work the world is characterized by constant growth rates, and it just so happens that there was a consistent slowdown in those constant growth rates over the 20th century. What he’s providing is not proof, but rather an extended argument that it is far easier to forecast growth using the additive model. Given that, it probably makes sense to think about how and why economic growth looks to follow that additive model.
So let’s take Philippon’s result seriously. There are a number of interesting implications of these results. One is that additive growth eliminates the apparent drop in volatility in TFP growth after World War II. The growth rate of GDP is very volatile from 1890 to 1940 (or so). It jumps around in a range that goes from -10% to positive 10%, even though the average is around 1.2%. After WWII the range is only -1% to 4% (or so). I’ve seen this kind of data before, and I always assumed it had to do with poor measurement of things like capital and labor prior to WWII (which would pass through into poor measurement of TFP). Philippon finds that the addition to TFP is in fact pretty steady over time, with no weird drop after WWII.
That is, with one exception. There is a distinct jump in the addition to TFP around 1930 (or so). You can see the consequences of this most easily in another one of his figures.
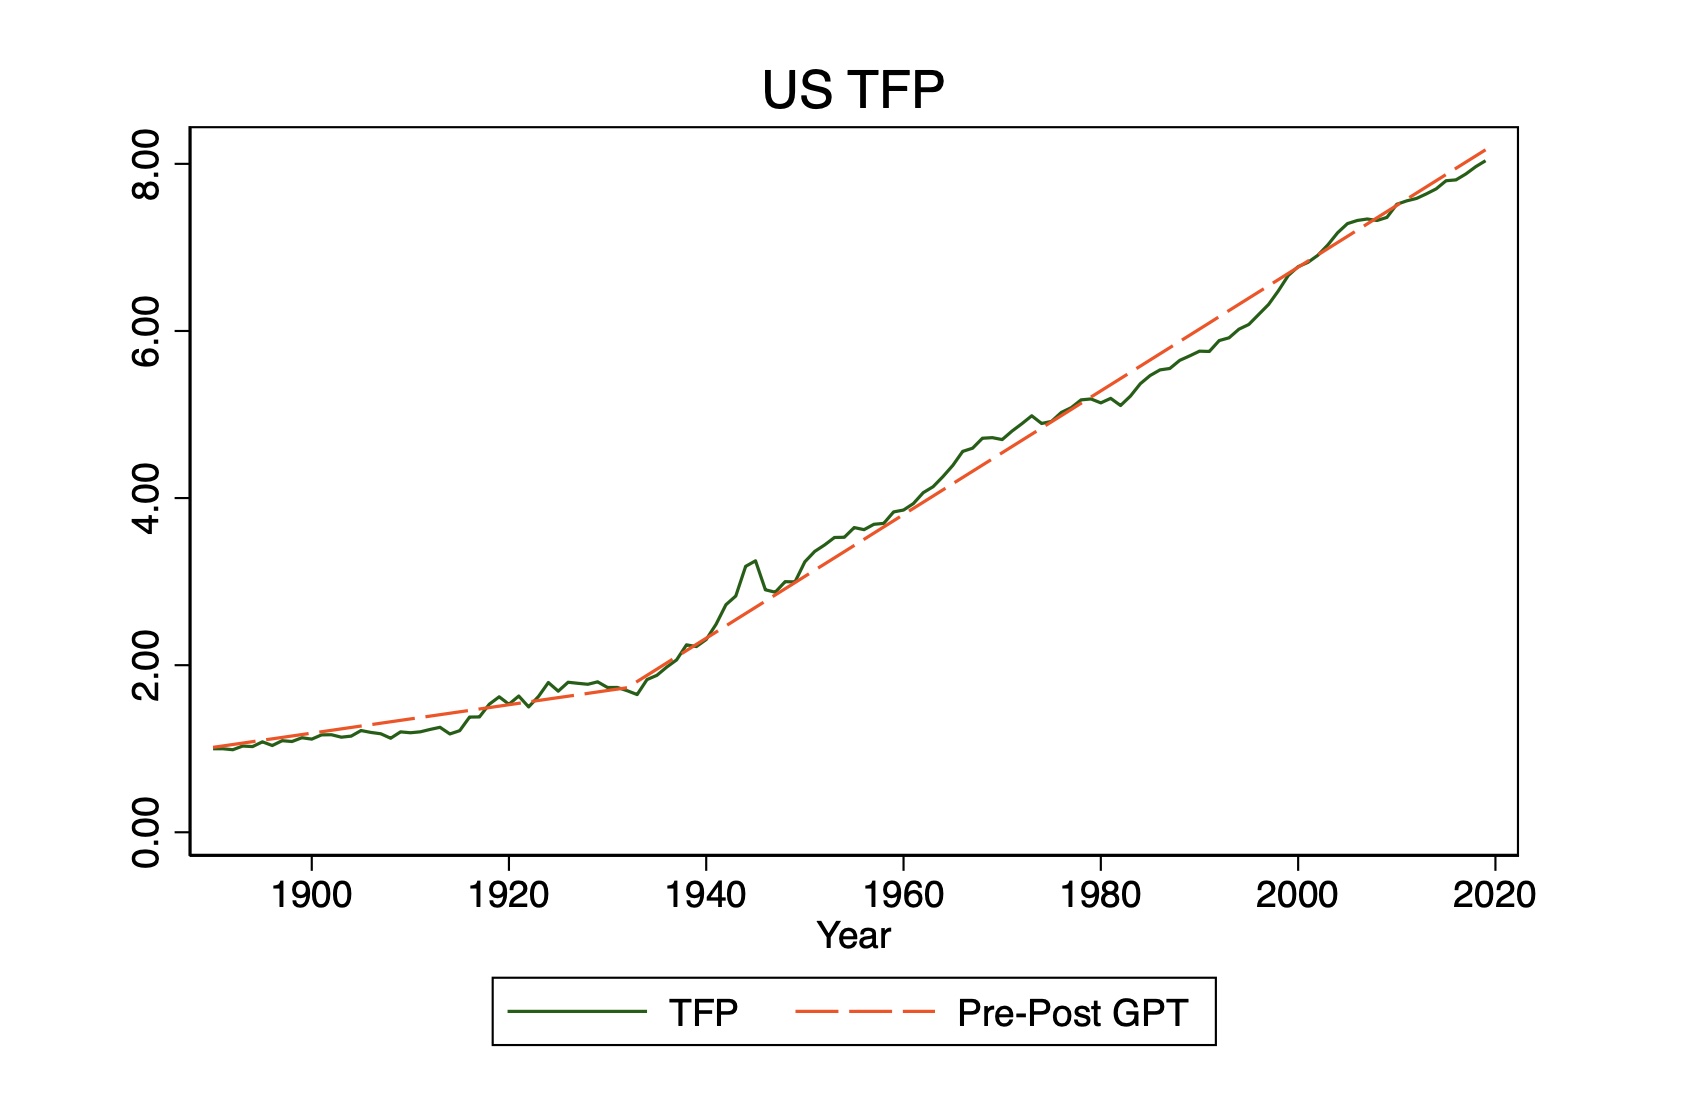
From 1890 to 1930-ish, the addition to TFP was about 0.017 per year (using 1890 = 1). After that break the addition to TFP is around 0.057, and that lasts consistently until 2019. What Philippon chalks this up to the long-run application of electricity to the economy. There’s a whole other story to explore about why electricity generated this distinct jump in the increment to TFP (and why didn’t IT, or chemicals, or something else?).
These are all worthy of exploration, and my guess is we’ll get several papers in the next few years tackling these. What I’ve got for you here is some new data to throw some sand in the gears, and then the implications of Philippon’s work for growth theory.
Demographics and GDP per capita
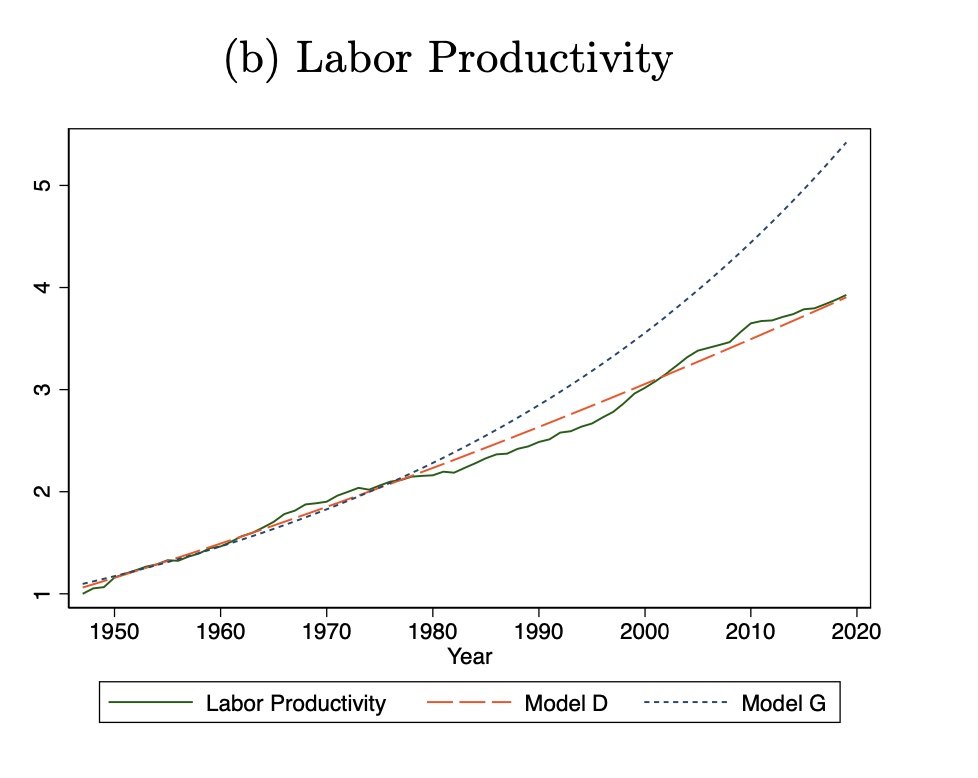
Everything Philippon does is in terms of GDP per worker, or GDP per hour, depending on dataset and sources. The measures of TFP are calculated using workers or hours as well. More directly, he does the assessment of labor productivity (GDP per worker) he finds the same support for additive growth. Here’s his figure for GDP per worker. It’s basically telling the identical story to the picture for TFP shown first in this post.
What I’m interested in is whether this pattern shows up with respect to GDP per capita. Do we see additive growth in living standards (which GDP per capita is probably a better measure of)?
What I did was replicate Philippon’s procedure using data on GDP per capita. Mine only runs through 2016 because of the dataset I used, but that isn’t going to be a big issue. I estimated both a “Model G” assuming exponential growth and a “Model D” assuming additive growth for the period 1948-1983. Then I forecast GDP per capita on the basis of the two models from 1983 to 2016.
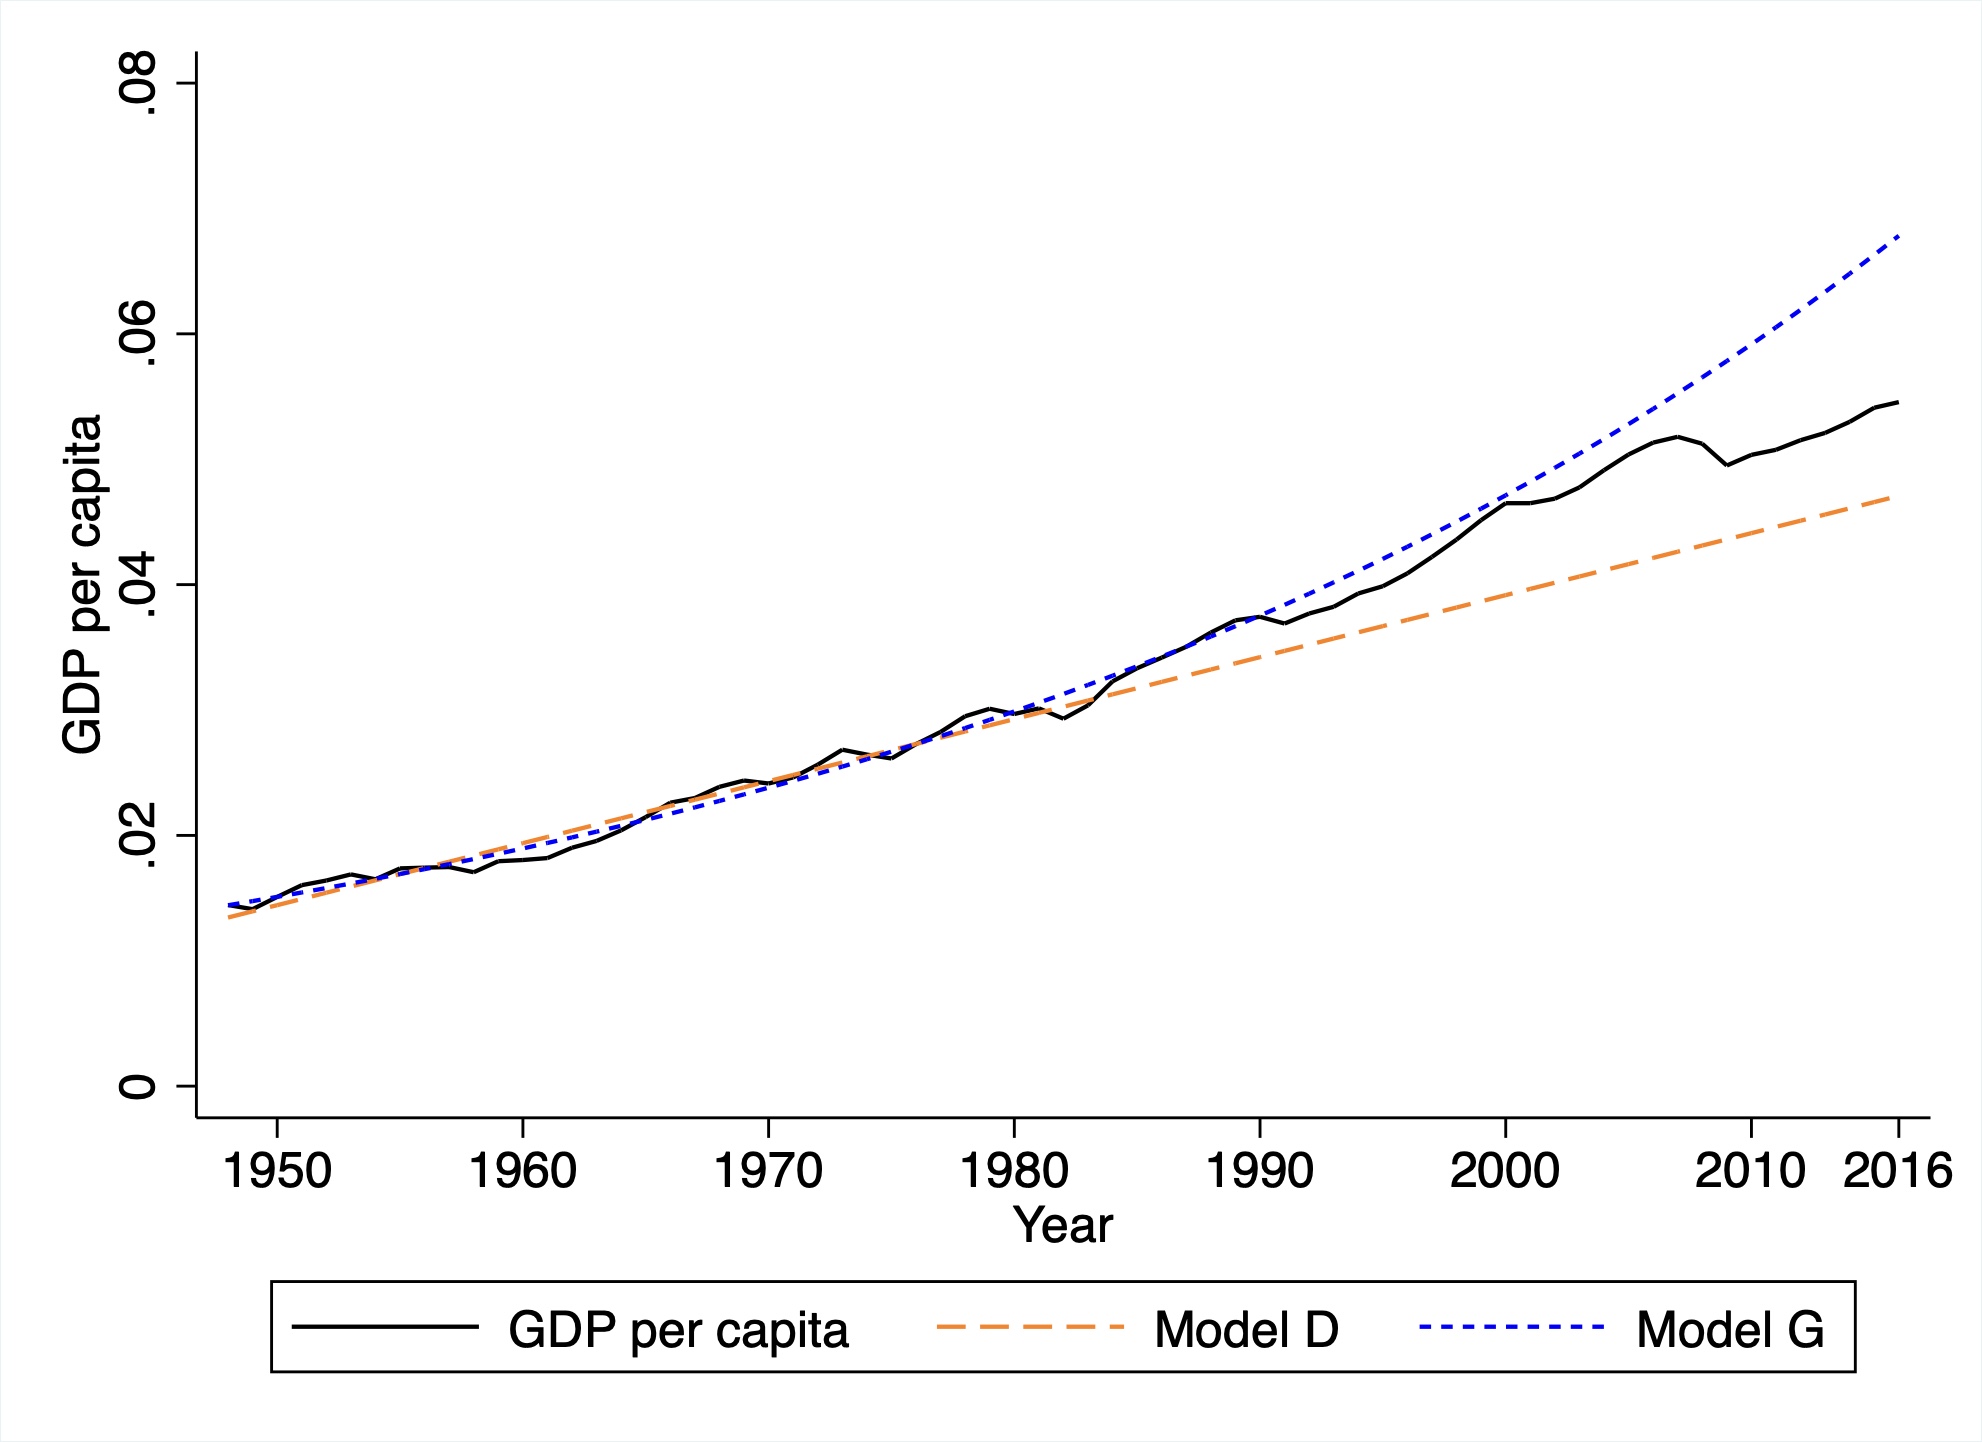
Here’s my figure, and I tried to use similar colors/lines so the comparison was clear. I didn’t normalize the y-axis to be 1 in 1948, as Philippon does, but that doesn’t change anything.
In terms of GDP per capita, the case for additive growth is less clear. From 1983 to about 2000 the exponential growth forecast looks pretty good. Up until the financial crisis in 2008 you can probably make a good case that it holds. After the financial crisis it looks more like the additive growth model is relevant? But there isn’t a clear answer like there is for Philippon’s use of labor productivity or TFP.
Why is this relevant? For one, it’s not obvious that we should care more about labor productivity (GDP per worker) than GDP per capita. The latter is more relevant to the state of overall living standards. The former is more relevant to worker productivity ignoring any demographic changes.
This distinction wouldn’t be important if demographic changes were basically random fluctuations in the ratio of workers to population. All that would mean was that there was some noise separating GDP per worker and GDP per capita. But we know that those demographics are not random, and that there is this massive demographic shift at work throughout the 20th and into the 21st century.
The pro-Philippon view on this would be as follows. Underlying TFP or labor productivity follows an additive model. But because of the surge in Baby Boomers during the 20th century (increasing the ratio of workers to population) this generating additional upward force on GDP per capita and gave us the illusion of exponential growth in GDP per capita up until around 2010. Following that, and the accelerating removal of Baby Boomers from the labor force (lowering the ratio of workers to population), this illusion is “clearing up” and GDP per capita itself is reverting to what we might expect to be an additive process going forward.
My figure doesn’t tell you that Philippon is wrong. It does offer another way of visualizing how massive the effect of the Baby Boom was on the economy. If you were focused on GDP per capita (and that would be a legitimate thing to worry about) you might have been over-confident on how relevant the exponential model was for growth, solely because of the surge in Baby Boomers. Demographics can be as powerful as a general-purpose technology like electricity in changing observed growth in GDP per capita.
Someone should write a book featuring those demographic changes as a big factor in how economic growth changed from the 20th to the 21st century.
Connecting R&D to productivity
(Added note on 8/16: this section is based on stuff in the Philippon paper, and in turn he cites a comment by Chad Jones for suggesting it. The original blog post may make it sound like I came up with this myself. I did not! - DV)
Perhaps the most interesting thing about the Philippon paper, to me, is that it turns a very bright flashlight on the connection of productivity (TFP) with the production of knowledge or ideas. In a standard textbook treatment of ideas and economic growth - like, for example, in my book with Chad Jones - the model is as follows. TFP is proportional to the number of ideas; a 10% increase in ideas means a 10% increase in TFP. The percent increase in ideas depends on the amount of research effort - which produces new ideas - relative to the existing stock of ideas; the more research effort you put in, the higher the percent increase in ideas (holding the stock constant).
Over time this creates something a race between research effort and ideas. Increasing research effort produces an increase in the number of new ideas being added every year. But those new ideas also keep increasing the stock of existing ideas, which pulls down the percent change in ideas that the new ideas imply. Having 100 new ideas given a stock of 1000 gives you a percent change of 10% in ideas (and hence a 10% change in TFP). Having 105 new ideas (because of more research effort) next year on a stock of 1100 ideas gives you a percent change of 9.5% (lower) in both ideas and productivity. And so on and so on.
With a setup like this, the growth rate of ideas (and hence of TFP) settles down until it becomes constant. That constant is proportional to the growth rate of research effort. Exponential growth in research effort is able to generate exponential growth in TFP.
This is what Philippon’s paper finds is counter-factual. So what in my above story has to change to match Philippon’s facts? The story makes it “too easy” for TFP to keep up with research effort. TFP rises proportionally with ideas, and new ideas flow proportionally to research effort. The data suggest that we have to add some friction into this model to slow down TFP growth enough such that it becomes additive.
To do that, you could make the link from TFP to ideas suffer from some severe decreasing returns. What I mean by severe is that a 10% increase in ideas leads to a less than 10% increase in TFP and (this is crucial) that the percentage increase in TFP is declining as we get more and more ideas. So a 10% increase in TFP in 1900 generated a 7% increase in TFP, but in 2000 generated only a 3% increase in TFP, and in 2050 will presumably generate only a 1% increase in TFP.
Why might this be the case? Well, there is nothing magic that says that ideas = TFP or that they are proportional. That’s always been an assumption made for convenience. You could think of the severe decreasing returns as embodying an idea like complexity. As we accumulate more and more ideas, they make us more productive, but each new idea has to interact with so many other ideas that the gain in productivity gets smaller and smaller. Think of self-driving cars. If we lived in a featureless plane with no obstacles, the ideas behind self-driving cars (the cameras, the software, etc.) would represent a massive increase in how productive we could be. But the self-driving car has to work out how to operate in a world populated by all sorts of obstacles that represent the benefits of other great ideas (like houses and traffic laws and paved roadways). So perhaps what Philippon’s data is telling us is that the link between TFP and ideas involves massive decreasing returns; new ideas don’t contribute as much over time because they have to be embedded in a system with other ideas.
The end result is that with sufficient severe decreasing returns in the connection from TFP to ideas you can end up with additive growth. The addition to TFP will become constant and proportional to the growth rate of research effort in the long run.
Taking Philippon’s results as gospel, their value is in narrowing down the range of acceptable ways to link TFP to ideas. I the next section I talk about what this means in math, but the upshot is that his paper tells us that the strict proportionality of TFP and ideas is wrong. Even more valuable, it gives us a very good idea of what the right mathematical representation of their link should be (log, for the win!).
Math!
I tried to do the entire above section in words, as I know some readers shy away from math. But for those equation-inclined among you, here’s the prior section again in more technical detail.
The existing model would tell you that TFP (A) is proportional to the number of ideas (I), as in $A = I$. It would also tell you that the change in ideas, $dI$, in a given time period is proportional to the research effort (R), so that $dI = R$. The first relationship implies that $dA = dI$, so it also implies that $dA = R$. Divide both sides by $A$ and you have
\[\frac{dA}{A} = \frac{R}{A}\]or the growth rate of TFP (the left-hand side) depends on the ratio of $R/A$. If $R$ is growing at a constant rate $g_R$, then the above equation tells us that in the long run the ratio $R/A$ will settle down to a constant and that $dA/A = g_R$ in the long run as well. The logic here is that if A is really small, it grows very fast (and hence R/A falls). If A is really large, then it grows very slowly (and hence R/A rises). Wherever you start, you always end up in this stable outcome with $dA/A = g_R$. But this outcome is one with a constant growth rate of TFP.
How do you generate constant additions to TFP? As above, we need decreasing returns, and severe ones. If instead it is the case that $A = ln(I)$, or that TFP depends on the log of ideas, then we get that $dA = dI/I$, or the addition to TFP depends on the growth rate of ideas. The growth rate of ideas is $dI/I = R/I$, and for the same logic I just went through above we’d get that in the long run $dI/I = g_R$. This in turn implies that $dA = g_R$ in the long run. Ideas grow exponentially, but this only generates constant additions to TFP because the increase in ideas hits such decreasing returns in generating TFP.
Why does this work? One way to think about this is that we have exponential growth in ideas over time. We need to “cancel out” that exponential growth in ideas to generate additive growth in TFP. The log operator cancels exponentials, so that works. A different way to see this is to take this equation, $dA = dI/I$ and re-arrange it a little. First, you can write this as
\[\frac{dA}{dI}I = 1\]which doesn’t mean much by itself. But divide both sides by $A$ and you get
\[\frac{dA}{dI}\frac{I}{A} = \frac{1}{A}.\]On the left is the elasticity of TFP with respect to ideas. On the right, you can see that this elasticity falls as TFP rises. This generates the action I mentioned in the prior section, that a 10% increase in ideas has to generate less than a 10% increase in TFP, and that the percent increase in TFP is falling as we get more and more ideas (and higher and higher TFP).
As another aside, we need the log operator in our $A = ln(I)$ to make this all work. Just having some decreasing returns isn’t enough. If instead we had $A = I^{\phi}$, with $\phi<1$, we’d have decreasing returns. The problem is that with this setup, the elasticity of A with respect to I is exactly $\phi$, a constant. As we get more and more ideas, the elasticity stays the same. In this case the presence of $\phi$ scales down the growth rate of $A$ in the long run, but not enough to eliminate the fact that $A$ would still grow exponentially. It’s only by asserting that $A = ln(I)$ that we generate enough friction to get to additive growth.
The right kind of paper
I like this paper a lot. I would imagine that the specifics of the estimations and presentations will change as the paper goes through refereeing for publication, but it seems hard to overlook the general pattern. To me it creates, at a minimum, an open question that any growth model would have to address going forward (i.e. is your model consistent with additive growth?).
This is a great example of just digging backwards through assumptions to see if they hold up. In that sense the paper is enraging (in a good way), because anyone could have done the initial investigation of this at any point in like the last 20 years.
Taking the results as a given, a significant contribution is to provide a solid empirical basis for narrowing theory to a specific structure for the relationship of TFP and ideas, the $A = ln(I)$ stuff from the math section. That’s cool! That connection from TFP to ideas was always fuzzy, and now we might at least put some mathematical discipline on how they are related, even if we don’t have the specific story worked out in detail.
It leaves big questions on the table as well. Why did electricity (and not any other invention) result in a significant shift in additive growth? Was it in fact electricity that did this (and not, say, mass immigration and urbanization)? Is it possible to generate another shift in the additive growth increment?