After the post I did recently on profit shares and productivity calculations, I've been picking around the BLS, OECD, and Penn World Tables methodologies for calculating productivity growth. This has generated several interesting facts. Interesting in the sense that they raise even more questions than I had starting out. Today's post is just one of those things that I dug up,and will throw out there in case anyone has some ideas about how to explain this.
The BLS provides a measure of private business-sector multi-factor productivity (MFP). "Multi-factor productivity" is what I'd call "total factor productivity" (TFP), but to be consistent I'll refer to it as MFP here. Because the BLS is working only with information on private business sector output and inputs, they can do more detailed work building up capital stocks and labor inputs. The cost is that they exclude the government (all labor, no capital) and housing services (all capital, no labor) from their measures of output. So the BLS productivity number isn't going to line up exactly with a measure of productivity based on aggrete GDP, capital, and labor stocks.
That caveat aside - and that caveat may be part of the explanation for the interesting fact I outline below - here's the BLS series on MFP growth over the long and short run. I apologize for the x-axis in these - it was hard to get Stata to format these into a readable font size.
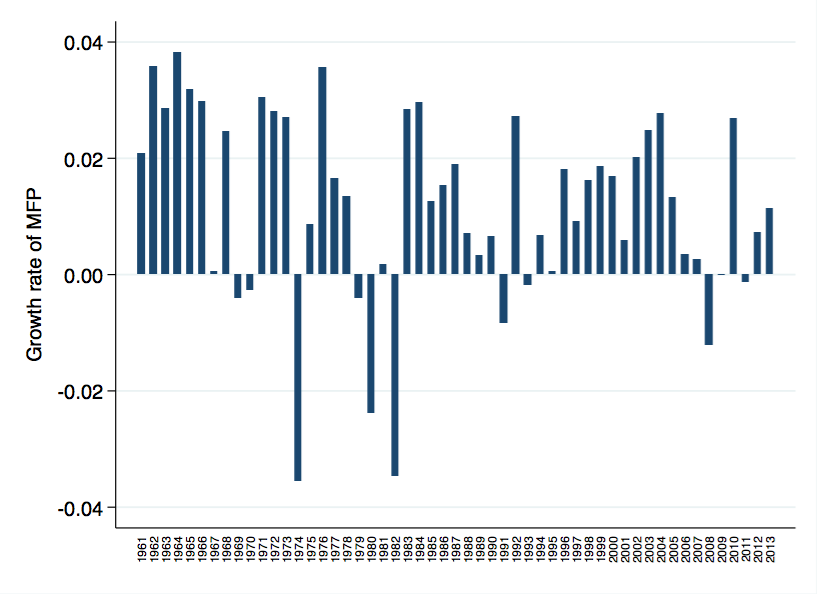
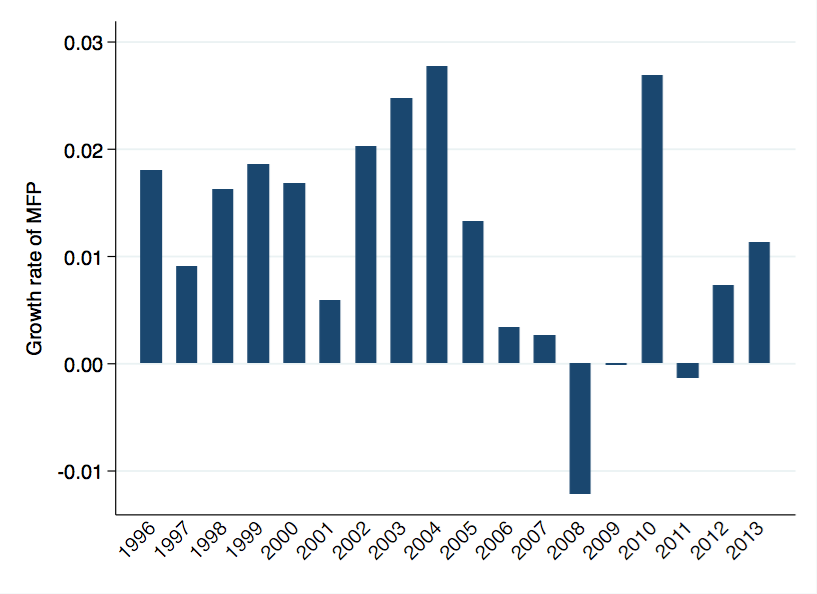
The basic story is familiar. MFP growth was relatively high from 1960. MFP growth has been relatively slow in the last 8 years, and I'd guess that when we have final numbers for 2014 and 2015 they'll look similar. A decade of relatively low productivity growth.
Why?
What I'm going to work through here is not a causal explanation, but simply an accounting one. But it may be a useful accounting exercise just because it highlights that the composition of productivity growth in the last decade, and in particular for the last few years, has been different than in the past.
To get started, we need to establish how exactly you measure MFP growth. We can write growth in multi-factor productivity (MFP) as the difference between growth in output per worker and growth in inputs per worker,
$$ g_{MFP} = g_{Y/L} - \alpha g_{K/L}. $$
By itself, this is pretty straightforward. If output per worker has a high growth rate, but inputs per worker has a low growth rate, then it must be that MFP is growing quickly. We are getting more output per worker even though we aren't adding lots of inputs per worker.
There are two things about this calculation that are going to be important for understanding MFP growth in the last decade:
- ${\alpha}$ is the weight on inputs (${K}$) in the production function, which we are assuming is Cobb-Douglas. If ${\alpha}$ were zero, then inputs like ${K}$ don't matter at all, and all growth in output per worker is, by definition, driven by growth in MFP. The size of ${\alpha}$ influences how much the growth rate of MFP depends on the growth rate of inputs per worker.
- If ${g_{K/L}<0}$, then notice this adds to MFP growth. If we have some growth in output per worker, ${g_{Y/L}}$, but we used fewer inputs to get it, then by implication it must be that MFP was growing very quickly.
Look at what happened to ${g_{K/L}}$ over the last few years. The figure below is the growth rate of ${K/L}$ year-to-year, from 1996 until now. You can see that we have this atypical shrinking of capital per worker in this period.
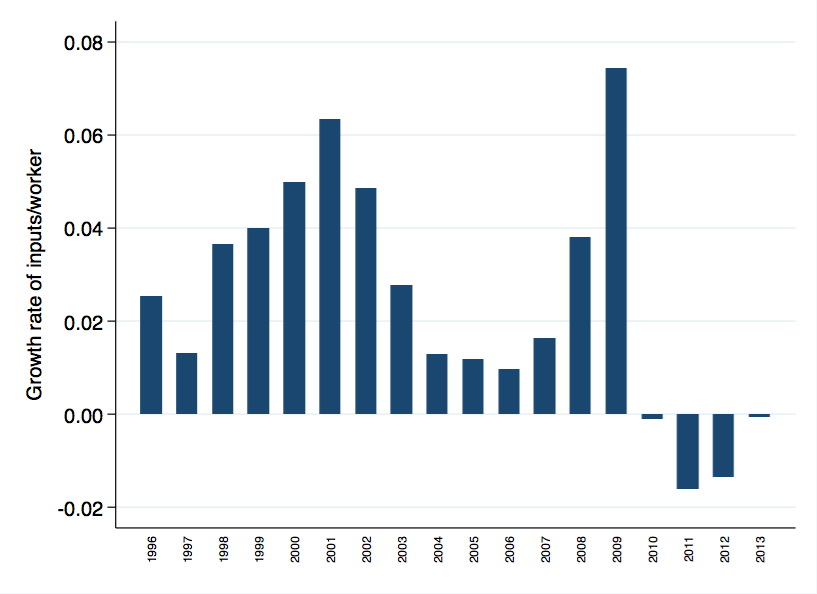
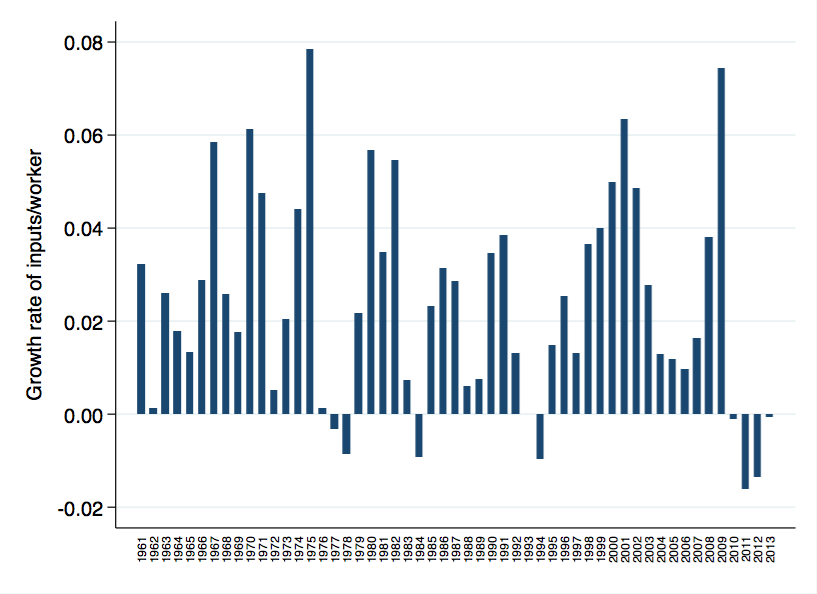
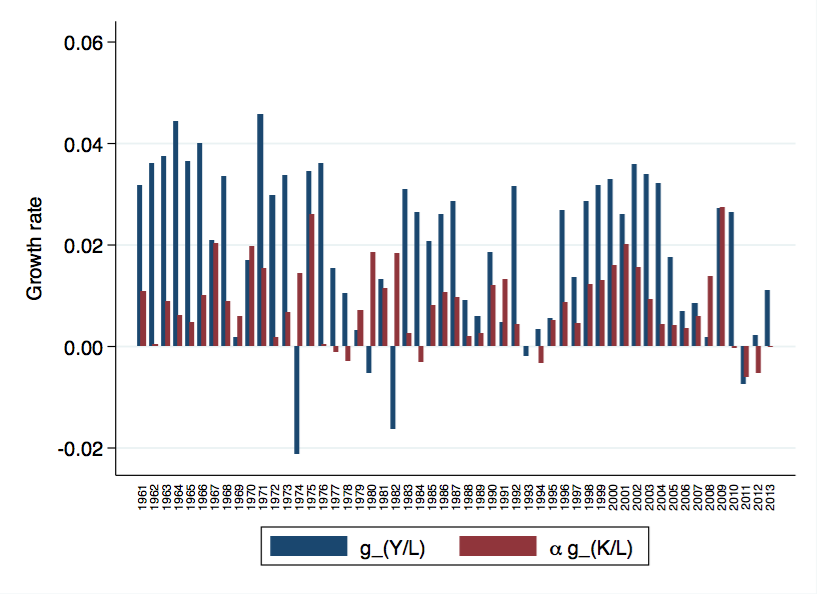
If you extend the series out to 1961, you get a similar message. It is pretty atypical for ${K/L}$ to shrink, and unprecendented in the post-war era for it to shrink 4 years in a row.
Flip over to look at ${\alpha}$. Here, I have to dip in and remind everyone that this weight is not something that we can observe. We can infer it from capital's share of costs. One reason working with the BLS data is nice is that they specifically report capital's share of costs, not just capital's share of output (that's a different question for a different post). Take a look at what happens to ${\alpha}$ in the last few years.
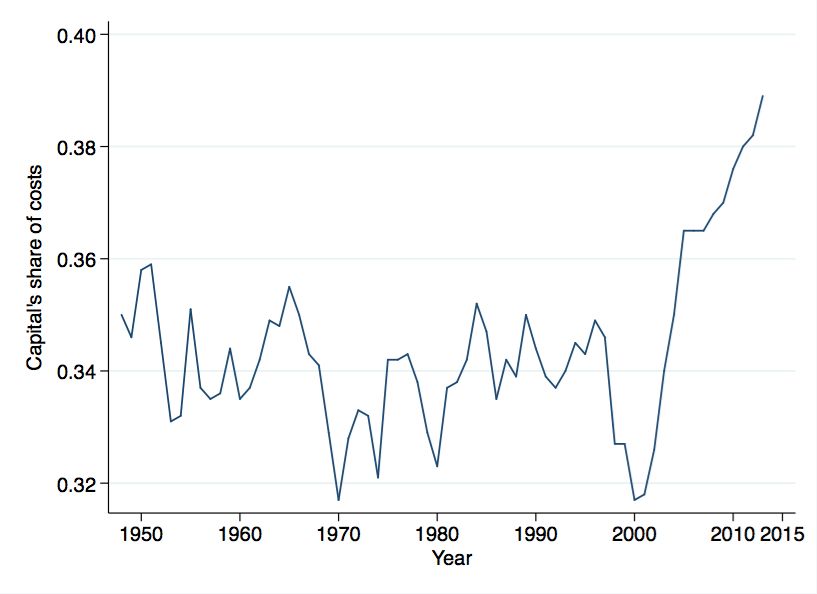
There is a clear, completely out of the ordinary, surge in capital's share of costs in the last few years. Thus the ${\alpha}$ that goes into the calculation of MFP growth is rising. This means that whatever is happening to input per worker is getting amplified in it's effect on MFP growth.
Combine those two facts: ${g_{K/L}<0}$ and ${\alpha}$ rising. What do you get? You get a distinct positive effect on MFP growth. The composition of MFP growth is different than it used to be.
What we've got going on in the last few years is that MFP growth reflects our economy using fewer inputs to produce the same output, rather than producing more output using our existing inputs. You can see the difference in these figures. I've plotted ${g_{Y/L}}$ (blue bars) and ${\alpha g_{K/L}}$ (red bars) for each year. The difference between these bars is MFP growth.
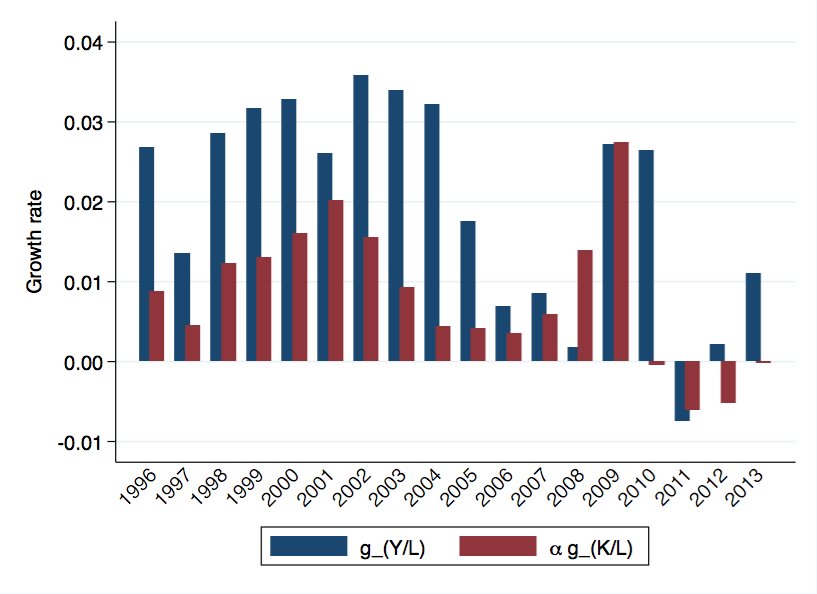
Up until about 2005, we generally had high input per worker growth. MFP growth allowed us to use inputs more efficiently, and we took advantage of that by using our increasing inputs to increase output by a lot. In the last few years, though,we have taken advantage of MFP growth by shedding inputs while increasing output only a little. Those red bars below zero from 2009-2013 all imply positive MFP growth.
There is nothing inherently right or wrong about this change. But it is different. A good question is whether this is something that represents a temporary change, or whether we've entered on a long-run path towards lower and lower input use while output per worker only grows slowly.
From a pure welfare perspective, there is nothing to say that lowering input use makes us worse off. We have to provide fewer inputs, which is nice. But an economy that is shedding inputs rather than expanding output sure seems like a different animal. What does it imply for asset prices, for example, if we are actively letting capital stocks run down?
It is one of those asset stocks that may play a role in explaining what is going on here, by the way. Remember that caveat I made above. The BLS excludes housing services from it's measure of output, and by housing services I mean the implicit flow of rents that home-owners receive. However, the BLS does, according to their documentation, include residential capital as part of their measure of ${K}$. The decline in housing investment since 2006/07 is going to actively drag down ${K}$, perhaps so much that it explains most of the ${g_{K/L}<0}$ - I can't find the detailed breakdown from the BLS to be sure.
If the decline in housing stock is responsible for ${g_{K/L}<0}$, then it is implicitly responsible for a large part of the measured MFP growth that we have enjoyed in the last few years. Will that continue? It's hard to think of a decline in the housing stock as a permanent state of affairs, so it may be a temporary deviation.
As an aside, this could imply that measured MFP growth in the early 2000's may have been lower because of the run-up of housing capital in that period.
Regardless, it seems odd that the BLS uses residential capital in their calculation of ${K}$, while excluding housing services from their calculation of ${Y}$. I'd love to see some kind of alternative series of MFP growth where residential capital is excluded from ${K}$.
But if the change in the nature of MFP growth is true regardless of how we treat residential capital, then there is something very odd going on. Remember, I didn't make any causal claim, solely an accounting claim. The composition of MFP growth has changed demonstrably, and now reflects declining input use per worker. Could it represent a change in the kind of technological change that we pursue or are exposed to? Are we now inventing things to eliminate the need for inputs, where before we used to invent things that made inputs more valuable? If yes, that represents a real change from several decades (and probably even longer) of productivity growth.