The last post I did on the composition of productivity growth documented that recently we appear to be using productivity to reduce our capital/worker, as opposed to increasing the growth of output per worker. The BLS measure of ${K/L}$ is actually shrinking in 2011-2013. That is an anomaly in the post-war era, and seems worth digging into further. Here is some more detail on what is driving the negative growth in ${K/L}$.
- Let me start with a correction. I said in the last post that the BLS was including residential capital in their calculation of ${K}$, but that imputed income from owner-occupied housing was not included in ${Y}$, and that seemed strange. The BLS includes tenant-occupied residential capital in their calculation of ${K}$, and tenant-occupied rents as part of their measure of ${Y}$. They exclude owner-occupied residential housing from ${K}$, and imputed owner-occupied rents from ${Y}$. In short, it seems kosher.
- The decline in ${K/L}$ in the last few years is a function of ${L}$ growing faster than ${K}$, but ${K}$ is still growing. The figure below shows the separate growth rates of both ${K}$ and ${L}$ over the last 20 years.
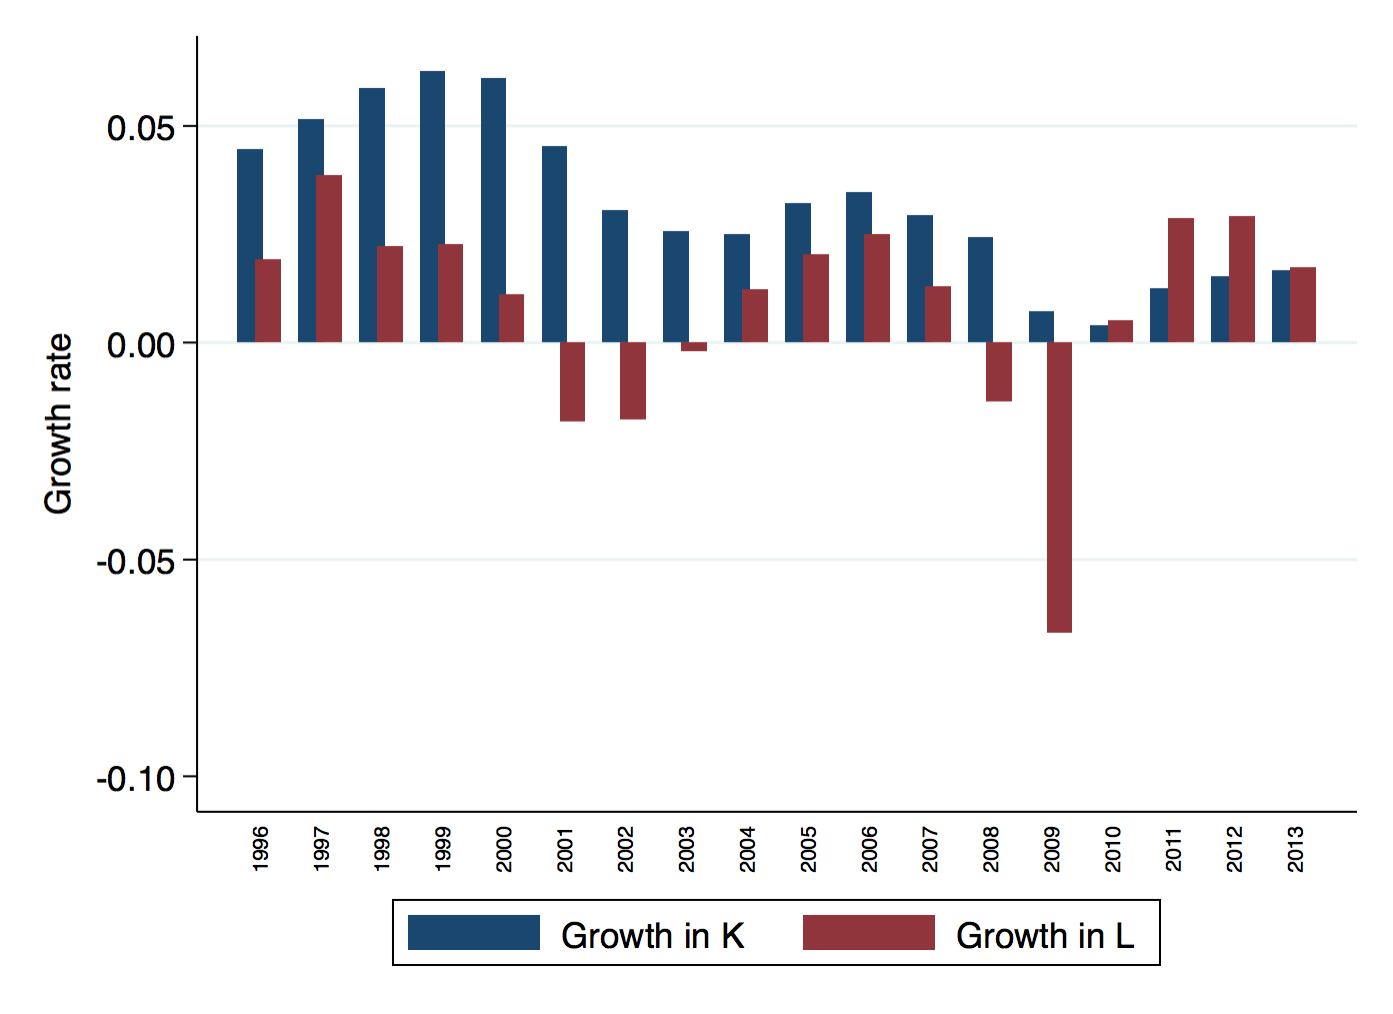
The growth in ${L}$ is relatively large compared to ${K}$. Why is ${L}$ growth so large? This is a composite measure created by the BLS that measures hours worked, and is weighted by worker type (education, etc..). So it is quite possible to have very strong growth in ${L}$ because hours worked of those employed are higher, even though the absolute number of workers is not growing rapidly. Regardless, ${K/L}$ is falling because growth in ${K}$ is relatively slow. But it is not negative.
- Is the slow growth in ${K}$ caused by any particular type of capital? The BLS has separate measures of equipment, structures (think warehouses), intellectual property (think software), land, rental housing, and inventories. We can look and see which, if any, of these are particularly responsible for the slow growth in ${K}$. What I've plotted here is the weighted growth rate of each category of capital. The weighting is their share in total capital income, which is how the BLS weights them to add up total capital growth. This makes the different colors comparable in how they influenced the growth of ${K}$ in a given year.
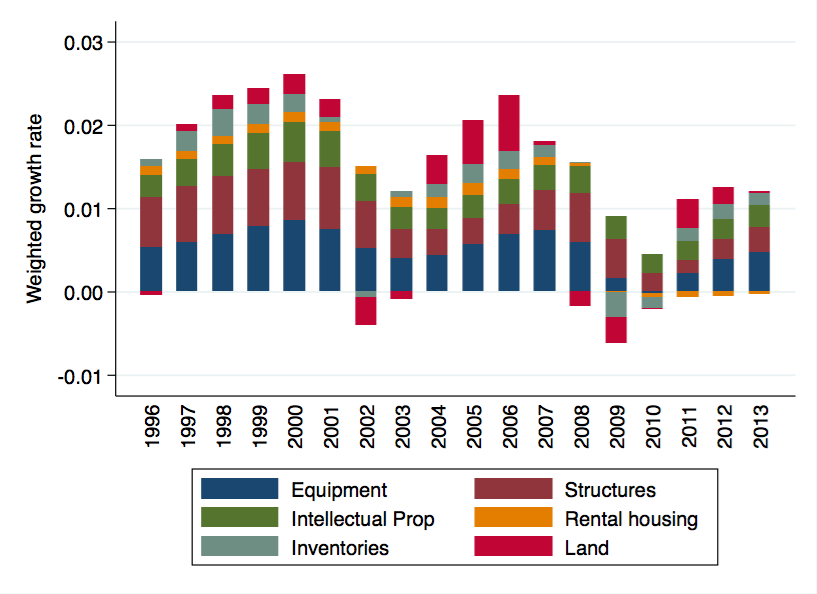
Looking over the last 4-5 years, there was clearly shrinking inventories (grayish/green) and land (red) during the recession. Since then, there has been negative growth in rental housing capital (yellow) over the last 4 years, but this is a really small effect on aggregate ${K}$ growth.
The rest of the categories are growing. But if you compare them to pre-2007 rates, they are all growing slowly. Equipment grew at about 1.8% per year, for example, in 2011-2013, but at 2.6% per year prior to 2007. Structures grew at 0.6% per year 2011-2013, but 1.5% prior to 2007. IP grew at 2.9% 2011-2013, and 5.2% prior to 2007. Rental housing shrinks at 0.6% 2011-2013, and grew at 1.1% prior to 2007. Inventories and land growth rates are roughly similar in the pre-Great Recession and post-Great Recession periods.
The overall decline in ${K/L}$ is thus not driven by any one single category of capital. Even the reduction in rental housing stock is not really that meaningful in absolute size, and it never was that big of a contributor to ${K}$ growth to begin with. This is a broad-based decline in capital growth rates.
What that indicates about the source of this change, I don't know. I have to think harder on that. It certainly seems to indicate a secular change in investment behavior, though, rather than reallocation away from some category and into another. So explanations that build on a common drop in savings/investment rates are likely to be successful here.
- Because I love you all, I extracted the BLS aggregate labor input data from a PDF, to see what was going on. The figure shows that the BLS labor input measure (the blue bars) contracts sharply in 2008/09, and then has grown at a relatively normal rate of about 2.5% per year since then. This is driven almost entirely by changes in the growth rate of hours (red bars). The growth rate of labor ``composition'' (green bars) is basically consistently positive over this whole period, but at a low rate of growth. Composition is capturing the quality of labor; think education levels.
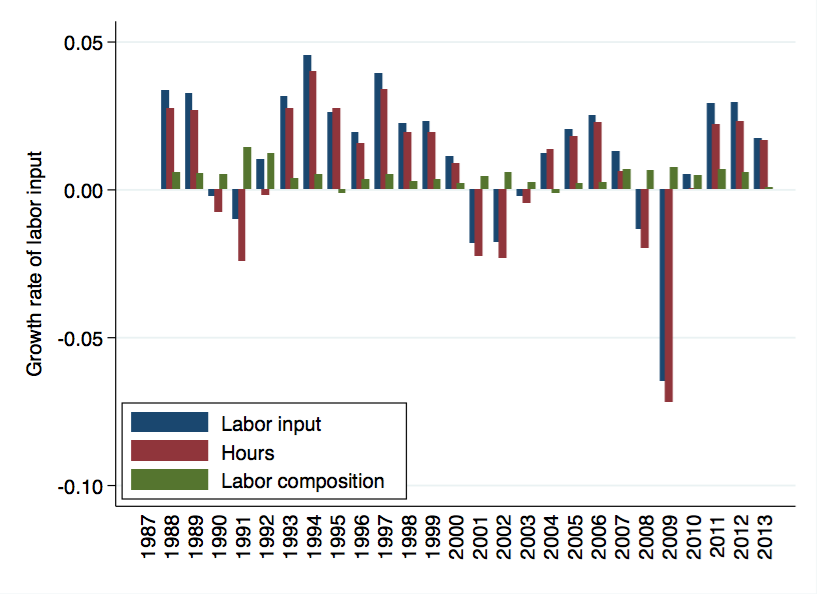
In 2011-2013 you can see that the labor input is growing at really robust rates compared to the historical series. This is the strong ${L}$ growth that, combined with the slow growth in ${K}$, is part of the slow growth in ${K/L}$. Why does it appear that labor input is growing so robustly in the BLS data? This is private business sector data only, excluding the government, which is a huge employer and has not been expanding employment much. So the private business sector labor input has been growing robustly, even though the labor input at the national level may not be growing as fast.
- The labor data and capital data seem to indicate that this is some kind of broad slow-down in investment in capital goods, and not some temporary adjustment by one type of capital. This drop occurs exactly when the Great Recession ends, so it seems that the changing financial conditions since then (ZIRP? Credit tightness?) may be responsible, as opposed to something like demographics. If it was demographics, why did all of the sudden after the GR did people decide to stop investing? Did all the Boomers get old all at once?
Whatever the cause, let me just remind everyone that there is no a priori reason that the decline in ${K/L}$ is a bad thing. A perfectly reasonable response to higher productivity is to reduce the use of inputs. But it an an anomaly, and it seems unlikely that everyone decided all at once that they'd like to shed inputs rather than increase output. Whether it has a detrimental long-run effect on growth is not something I can say given the data I've got.