I discussed a paper by David Cuberes and Marc Teigner at the SEA meetings in New Orleans a few weeks ago. It provides some interesting calculations on the economic cost of discrimination against women in developing countries.
CT set up a simple model of occupational choice, a la Banerjee and Newman, where people can be (a) workers, (b) self-employed entrepreneurs, or (c) firm owners with multiple employees. As in that standard model, there is some distribution of managerial talent, and so the most capable managers become firm owners, and hire lots of employees. Those with medium management skills run firms, but it only makes sense for them to hire themselves (self-employed). Finally, those with low management skills find it more lucrative to work for the firm owners than start their own firms.
What CT add to this is frictions that prevent women from entering those different categories, even though their distribution of managerial talent is similar to that of men. They set this up so that if affects the number of women in each category, but not the distribution of their skills. For example, if 100 men have sufficient management skills to become firm owners, then 100 women presumably also have sufficient management skills, but the friction means that only 20 of them get to be firm owners. The average skill of those 20 is the same as the average skill of the 100 men (the friction discriminates purely on gender, not on talent).
This takes place all down the line. So you have fewer female firm owners, fewer female self-employed entrepreneurs, and fewer female workers. Now, because we have gotten rid of some possible firm owners and entrepreneurs, we are worse off. Fewer firm owners means lower demand for labor, so the wage of workers is lower. Thus more people (men and women) want to become self-employed. So the firms that do exist are smaller (fewer workers are available) and more of the population works as self-employed entrepreneurs. On the other hand, if few enough women are in the labor force, then the wage of the men and remaining women may actually be higher, which also limits the incentive to start a firm. Regardless, we get distortions to the number of firms, distortions to the wage of workers, and distortions to the number of self-employed entrepreneurs. In the end, this results in lower output per capita.
How much lower? That is the real contribution of CT. They take survey data from a set of developing countries that contains information, by gender, on whether people are workers, self-employed entrepreneurs, or firm owners. They then ask what kind of frictions are necessary in their model to generate the observed numbers. Once they know that, they can ask the counter-factual question of what output per capita would be if they removed any or all of the frictions to women.
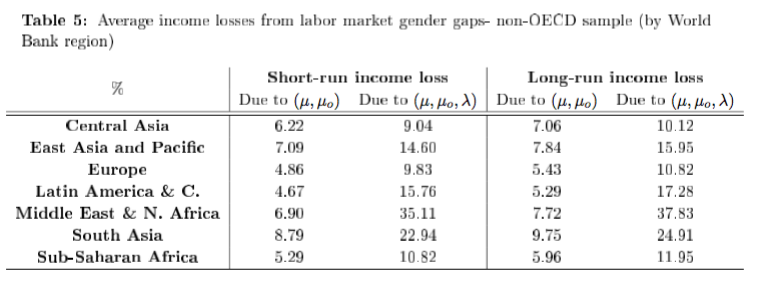
Their Table 5 shows the percent loss of income per capita due to various frictions. Focus on the long-run loss columns (which have allowed for capital to adjust to the lower supply of labor). The first column, with a 7.06% loss for Central Asia, shows the impact of the frictions that limit women from becoming firm owners and/or self-employed entrepreneurs. As you can see, there is a sizable loss across regions, ranging from about 5-ish% to not quite 10%.
The second column adds in the loss from limiting women from becoming workers. In other words, limiting their labor-force participation rate. This increases the loss in all regions of the world, but there is really wide variation in the effects. The full set of frictions lower output per capita by about 37% in the Mid-East, for example, due to very low labor force participation rates by women. South Asia has a loss of about 25% of output per capita. The other regions have losses that are still sizable, but not quite as large in absolute terms.
For comparison, CT did the same calculations for OECD countries, and report those in their Table 3, shown below. Here, they break the results down by percentile of losses. So Top 25% means the average loss of the quarter of OECD countries with the biggest losses.
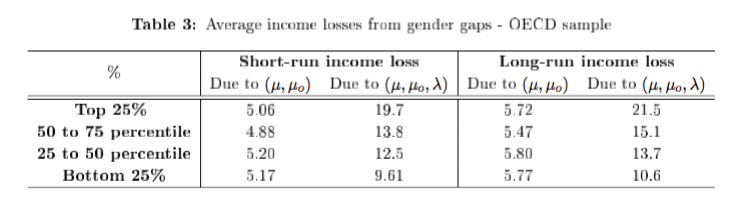
While not quite as bad as the Mid-east, the worst OECD countries have losses from frictions towards women's work that are as costly as in many developing countries. Even the Bottom 25%, representing the countries with the smallest losses, are losing 10% of output per capita from frictions towards women, which is no better or worse than any developing region of the world.
One interesting note about both tables is that the losses associated with just the frictions towards self-employment and firm-ownership (i.e. losses due to ${\mu}$ and ${\mu_0}$) are relatively consistent across all OECD groups and developing regions, at between 5 and 7 percent. Rich countries are not necessarily any better at limiting these frictions than poor countries. When you add in the labor-force participation effects (i.e. losses due to ${\mu}$, ${\mu_0}$, and ${\lambda}$), there we still find that there is not a significant advantage for the OECD. The implications is that the OECD is not richer than developing countries because it treats women better. It is rich despite the fact that it puts up barriers to women participating in the labor force and/or in entrepreneurship.
When I discussed the paper, I threw up the following quote from David Landes' The Wealth and Poverty of Nations, p. 413:
In general, the best clue to a nation’s growth and development potential is the status and role of women.
These numbers seem to indicate that this might not necessarily be right. It is not necessarily true that rich countries put women to work in a more efficient manner than poor countries.
One way that Landes' point could manifest itself is in which women are discriminated against. The CT model has frictions that apply in a blanket manner to all women, regardless of managerial ability or worker skill. If rich countries discriminate against low-skill women, but allow high-skill women to enter the various categories of professions CT use, then this would limit the loss of output per worker.
On the other hand, even if high-skilled women are not discriminated against in entering certain professions, they may still be discriminated against within those professions, and that would create further losses. Perhaps rich countries do less of this kind of discrimination? I don't know for sure, I'm simply trying to take Landes' idea seriously and think of how why CT's results might not be capturing it.
For the US, Hsieh, Hurst, Jones, and Klenow calculated that 15-20 percent of US growth in output per worker from 1960 to 2008 could be due to the improved allocation of talent across occupations due to the alleviation of discrimination. Again, they don't have measure of specific discriminatory practices, but use the fact that the race and gender composition of occupations is converging over time towards the aggregate composition. In their calculations, about 3/4 of the total gains from reduced discrimination are due to white women entering professions they previously were underrepresented in. 90% of the gains are due to reduced discrimination against all women (their table 10).
Landes' point could be valid if we think of the US (and other OECD countries?) doing better than poor countries in the allocation of women across occupations, conditional of them being allowed to work in the first place. Where we do not see major differences between rich and poor, as CT show, is in allowing women to work in the first place. The losses from this type of friction are roughly equivalent around the world, with a few notable exceptions (the Mid-East and maybe South Asia).
Now, it is simply implicit frictions that CT (and HHJK) calculate, and not a measure of the respect, status, or treatment of women in general. Landes may be right that the position of women is a good indicator of growth, even if the frictions that CT calculate are not much different in the OECD than in other regions. The position of women in society may well be an indicator of development (economic or otherwise) that is simply not captured in statistics on labor force participation or rates of entrepreneurship. But even leaving aside Landes' point, the CT results indicate a significant amount of money left on the table because of limitations on women's participation in economic life.