This may or may not be interesting, I’m not entirely sure myself. But I got a question from an undergrad in my economic growth course, and it was one of those questions that kind of catches you off guard because you hadn’t really thought about it. The question was - paraphrasing - “Why do we look at growth rates rather than how much GDP per capita actually changed?”.
“Duh, it’s a course on growth” is what I did not say. But it did take me a moment to shake that feeling. In his defense, the answer isn’t obvious. Why do we focus on growth rates - percentage changes - as opposed to absolute changes in GDP per capita? Growth rates maks major differences in the absolute change in GDP per capita. For example, a growth rate of 2% implies an absolute change of 1000 in an economy with a GDP per capita of 50,000, and only a change of 200 in an economy with GDP per capita of 10,000.
First, what does the distribution of aboslute changes in GDP per capita even look like? I had no idea. So I calculated the absolute growth in real GDP per capita per year for each country in the PWT. Then I plotted the kernel densities of these absolute changes for several countries. You can see the results below.
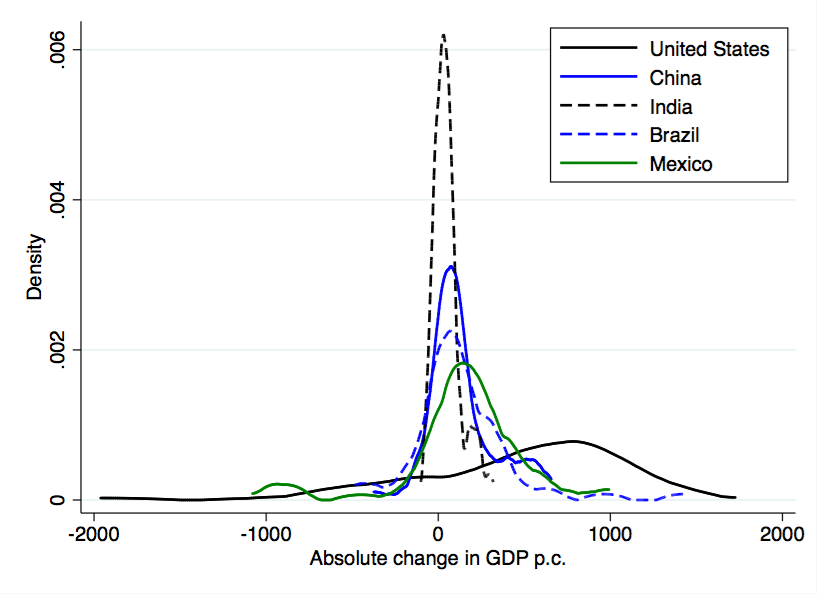
Kernel densities are basically smoothed histograms, so the height of the density curve indicates how often absolute growth in GDP per capita of a given amount occurred. As you can see, for India (the black dashed line) absolute growth tended to be very small. On average, from 1950 to 2011, GDP per capita rose by 51 dollars per year in India. The median was 42 dollars. Despite these small absolute changes, the percentage growth rate in could actually be quite high because GDP per capita is very low to begin with.
Compare that to the United States, where the density is much flatter and covers much larger values (both positive and negative). For the US, average absolute growth in GDP per capita was 482 dollars, with a median of 617 dollars. Of course, those large changes in GDP per capita reflect very small percentage growth rates in the US, because GDP per capita is already so large.
From the perspective of growth rates, the US isn’t growing very quickly compared to India, at least over the last 25 years. But in absolute terms, the increase in living standards in the US is about 10 times higher than in India in a given year.
Should we care about these absolute changes? The answer hinges on your view on how GDP per capita translates to welfare, the utility function. It is really common to assume “log utility”, or welfare is the log of GDP per capita (or consumption per capita, or something else proportional to GDP per capita). Log utility has the very particular property that the same growth rate of GDP per capita yields the same absolute change in welfare. If India and the US both have growth rates of 3%, then welfare in both countries rises by 3%, even though the absolute change in GDP per capita in the US is much larger. The figure above doesn’t have any information about welfare gains, in other words.
The reason for this is simply diminishing marginal utility. But log utility specifies that the diminishing happens in such a way that growth rates translate directly to absolute changes in welfare. Now what if utility is “more curved” than log? That is, what if marginal utility falls very quickly as GDP per capita goes up? Then even if two countries have the same growth rate, they do not have the same absolute change in welfare. In fact, the richer country would have a smaller change in welfare than the poorer country. So 3% growth in India generates more welfare than 3% growth in the US, even though the absolute change in GDP per capita is much smaller in India.
But we could go the other direction, and look at utility that is “less curved” than log, or where marginal utility diminishes very slowly. Now, if there are two countries with identical growth rates, the richer country has a higher gain in welfare. The limit case here is linear utility, where marginal utility doesn’t decline at all as you get richer. Then the absolute change in GDP per capita is all that matters, and the US has (on average) much larger gains in welfare every year than India.
An argument for thinking of utility as “more curved” than log is subsistence constraints. That is, let’s say that you only get utility from GDP per capita over and above a minimum level; GDP per capita at that minimum level is what we call subsistence, and it doesn’t provide any welfare, it just keeps you alive. If you have subsistence constraints, then marginal utility is incredibly high close to this constraint, and marginal utility falls very quickly as you move away from it. So India experiences much bigger gains in welfare - despite their small absolute gains in GDP per capita - because those extra 51 dollars get you farther away from that subsistence constraint. The US gets relatively little utility from its 482 dollar change, because we’re already so far above that subsistence constraint.
On the other hand, habit formation would be a force pushing towards “less curved” utility. In short, imagine that the subsistence constraint itself is rising as we get richer. The “minimum level” of GDP per capita that people need to meet is higher in the US than in India. If you believe that, then it is quite possible that the higher absolute growth of GDP per capita in the US is delivering bigger gains in absolute welfare.
Ultimately, then, I think the answer to the students question is that we think there is diminishing marginal utility, and so growth rate rates make sense because they tell us something about absolute changes in welfare. But…who said utility of GDP per capita has to be as curved as log? What if there are significant habit effects? Maybe the gap in welfare between places like the US and India is actually growing over time, even though India’s GDP per capita is catching up slowly.
Perhaps not a “Duh” question after all.