I had the pleasure of attending the DEGIT conference in Nottingham, UK last week. One of the plenary speakers was Gene Grossman, who talked about a paper he is working on with Elhanan Helpman, Ezra Oberfield, and Thomas Sampson. The paper is about “balanced growth”. I spent a good portion of the flight home thinking about the questions they posed, and ended up generating what will probably be two long posts on the subject. This first one was drafted in large part on that flight, having not slept the night before, so bear with me if I ramble a little.
Perhaps the main organizing principle in growth economics over the last sixty years has been the “balanced growth path”, or BGP. BGP is really just a name for a set of conditions related to several major pieces of economic data:
- The growth rate of output per worker is constant over time
- The rate of return on capital is constant over time
- The share of output paid to capital is constant over time
These three conditions are part of the the “Kaldor Facts” established in by Nicolas Kaldor in 1957. There are really six stylized facts in his article, but you can kind of boil them down to these three easily. These facts were supported by relatively sparse information gleaned from the period running from the late 19th century up to the 1920’s, and for most of them Kaldor ignored major changes that occurred in the Great Depression. For example, the fact regarding the rate of return is based largely on the 44 years from 1870 to 1914 in the UK. Saying that output per worker was rising steadily was inferred from several (uncited by Kaldor) sources in 1957, when the concept of national income accounting was only about two decades old. This was not a robust empirical exercise, is what I’m trying to say.
Regardless, the question for growth economists became: how must the economy work such that these three are all true in the long run? Subsequently, essentially every model of growth that has been written down has constricted itself to matching these facts. The term BGP is thus something of shorthand notation for saying that a model fits the Kaldor Facts, at least in the long run.
But does it make sense to constrict ourselves in this way in thinking about how economies grow? What I want to consider over this post and a planned follow-up is the answer to that question. Here, let me focus on the empirical side of things. The follow-up is going to deal with the theoretical side.
If you take the Kaldor facts as given, then sure, you should write down models that can reproduce them. But should we take the Kaldor facts as given? Like I mentioned above, these are facts gleaned almost exclusively from a period running from the late 19th century into the 1920’s, if that. It seems well worth asking if they continue to be true. If they are not true, or might not be true, then constricting our theories of growth to those having BGP’s is unnecessarily limiting.
As I go through this, I’m trying to take the most skeptical viewpoint I can on balanced growth paths. And this is precisely because I think the BGP is a good way to mentally frame our thinking about growth. The worry is that I (and maybe most growth economists?) are too stuck on the BGP as our organizing principle.
Is growth of output per worker constant over time?
Maybe the most prevalent figure in growth economics plots log GDP per worker in the US over time, usually from 1870 to until roughly 1990-2015, depending on the vintage of the paper you’re talking about. I probably have six or seven versions of it on my laptop in various folders, and one is included below.
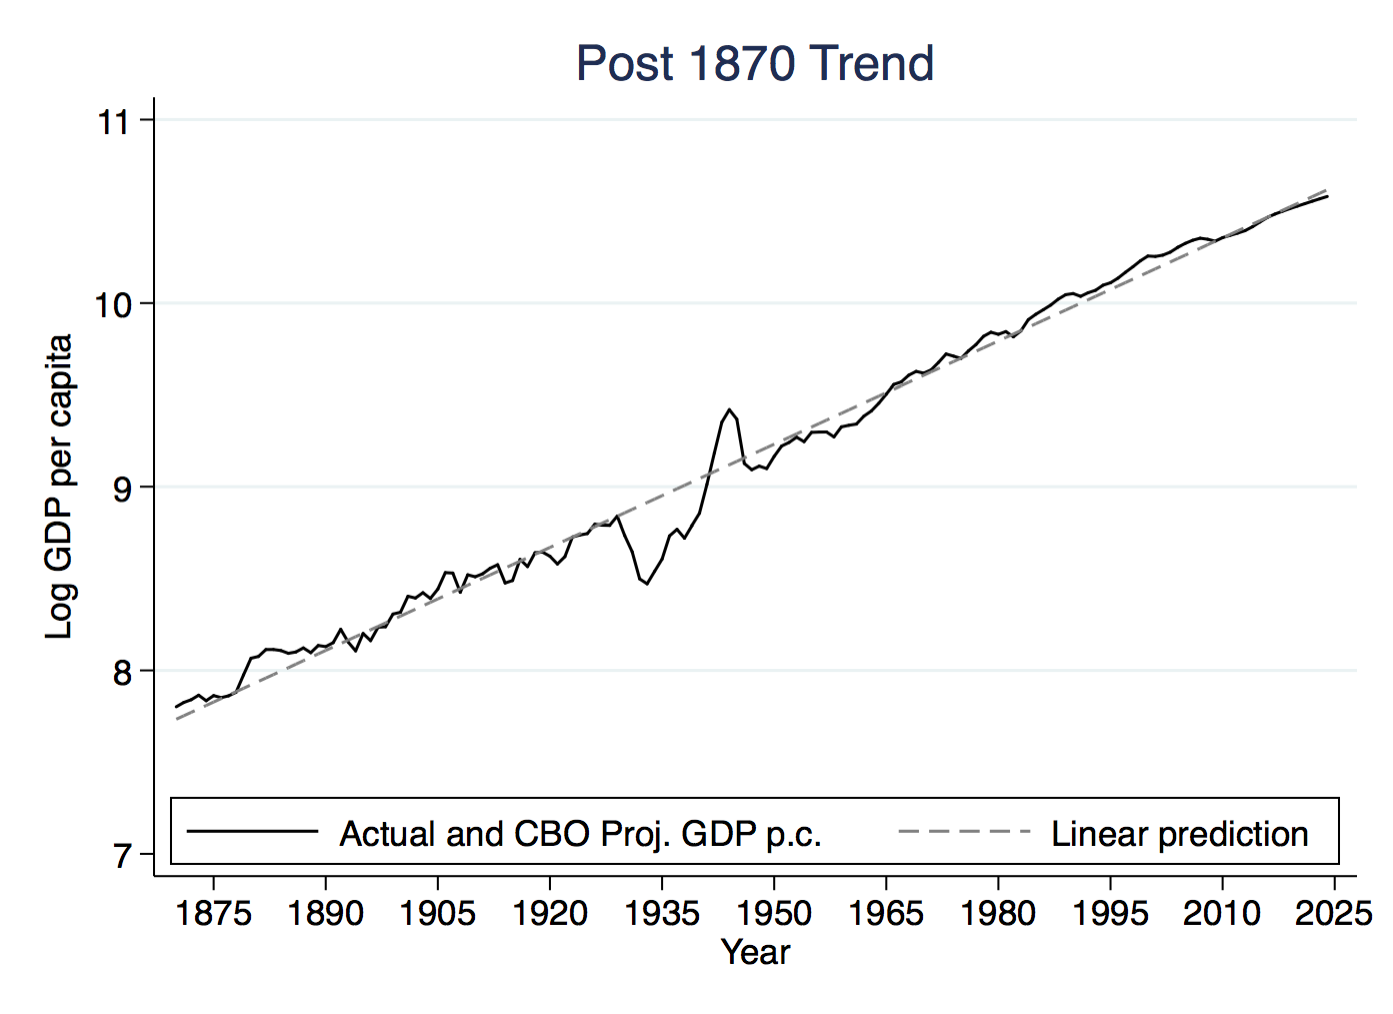
The remarkable thing about this figure is how consistent the slope is, and the slope (given that this graphs the log of GDP per capita against time) is just the growth rate. That is the first Kaldor fact, presented visually. Even after the disruption of the Great Depression and WWII, the US returned right back to the same trend line (the “linear prediction” dashed line) from before. So for the US, it seems there is very powerful evidence for the first Kaldor fact.
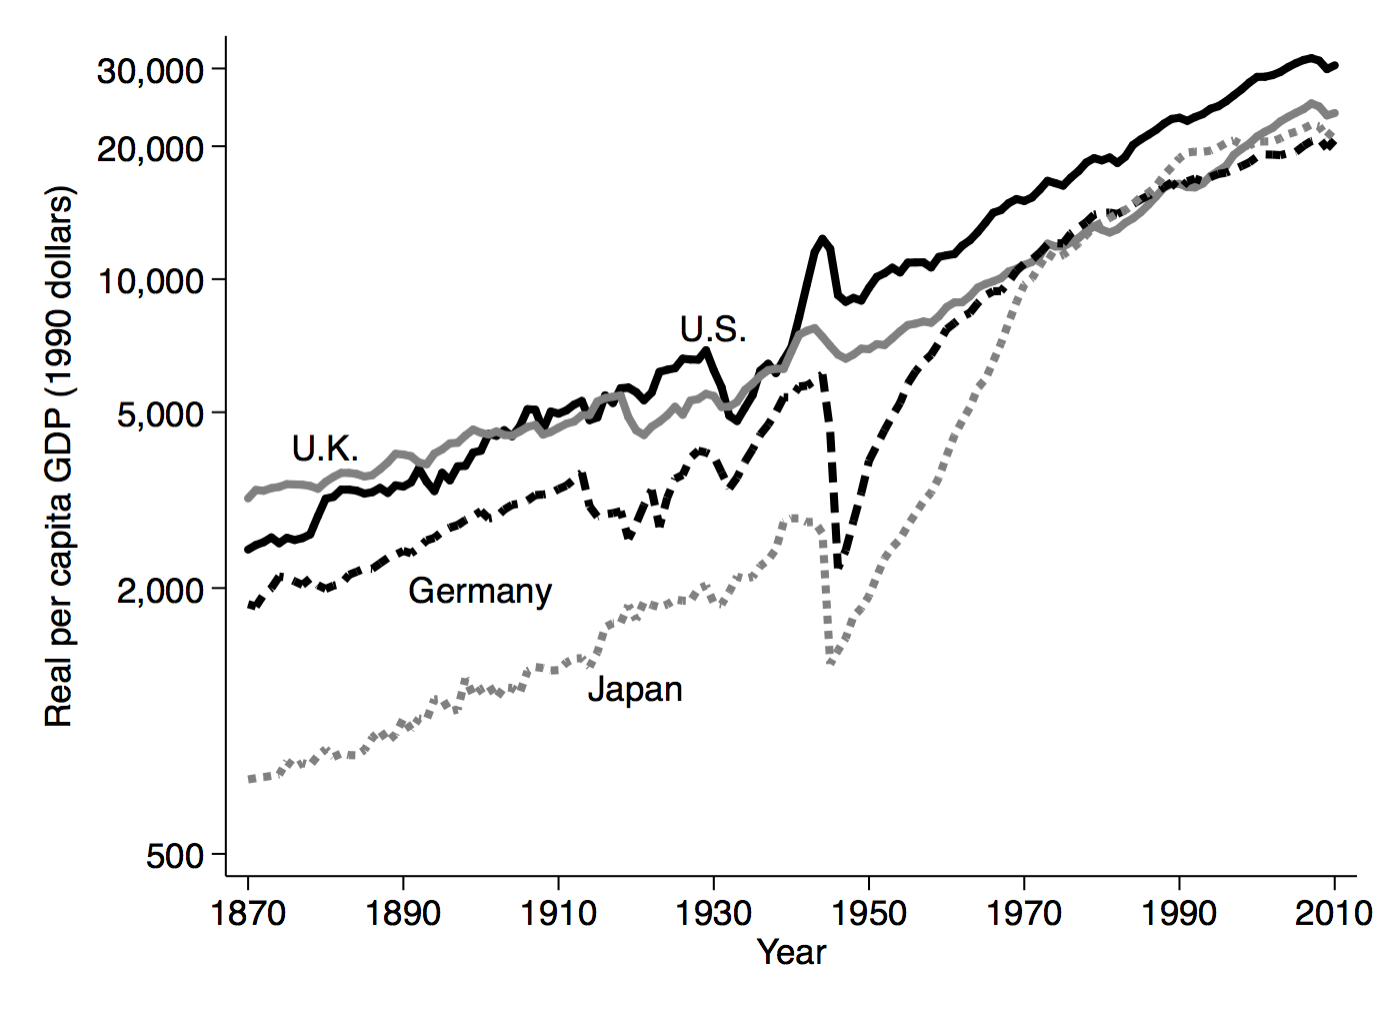
But, as is the case with far too many stylized facts, this is just the US. Not every country has such a consistent trend line. The figure below shows four major economies including the US, and you can see that Japan and Germany do not have this same consistent trend (while the UK does). Now, while this makes the first Kaldor fact strictly untrue, this doesn’t necessarily spell the end of the idea of a BGP. As I implied above, a BGP is really a statement about what happens in the long run. Like Germany or Japan after World War II, you could be off of the BGP, but as you can see with both countries they eventually settle into a situation of constant growth rates.
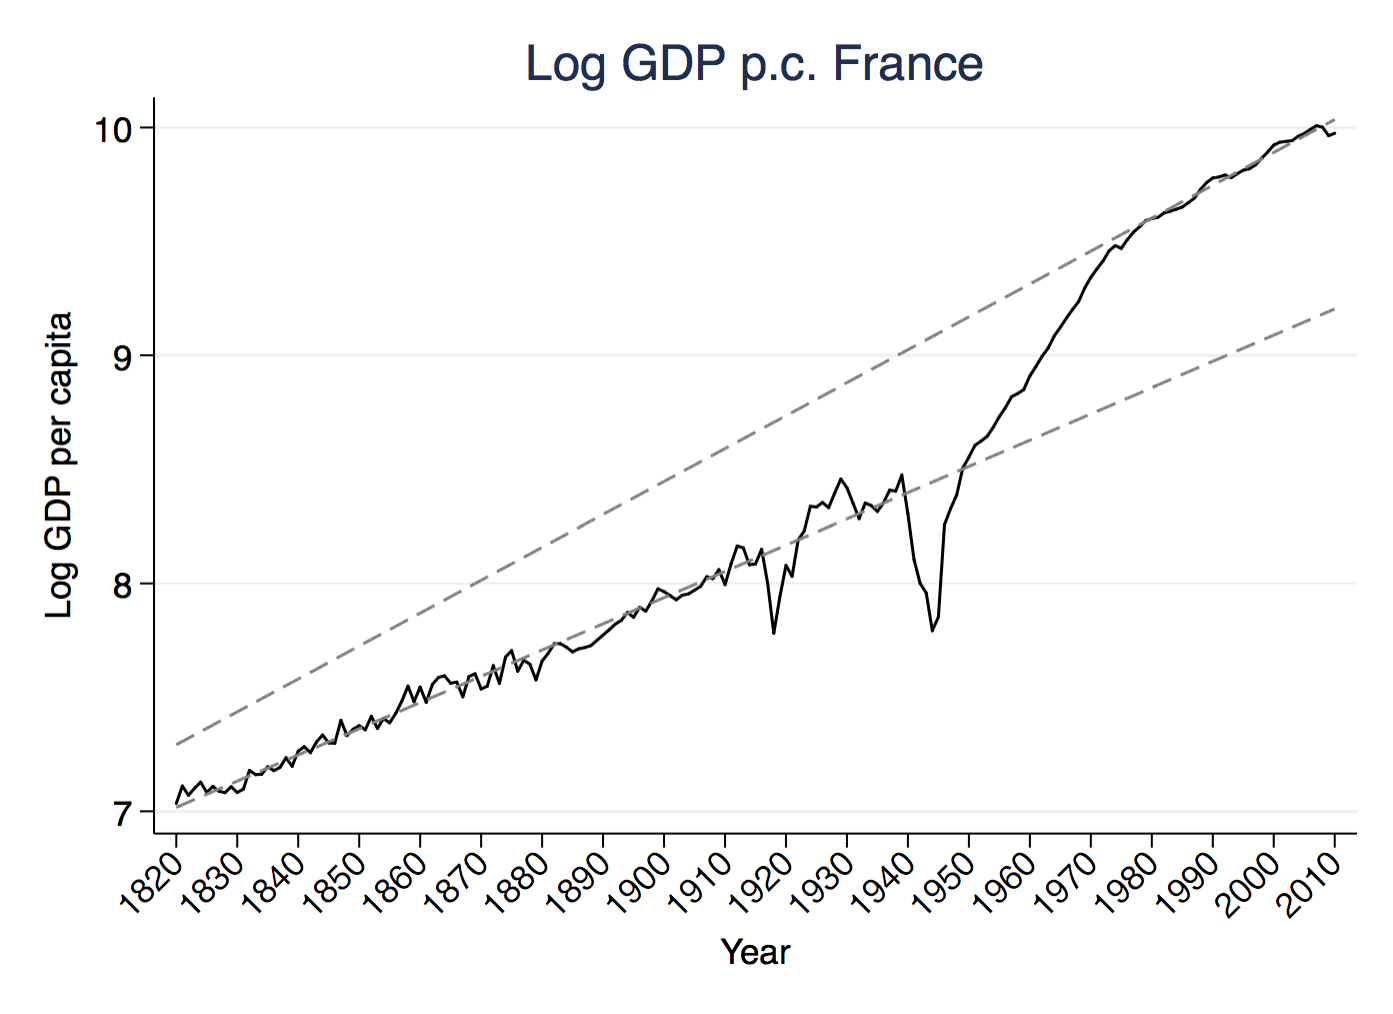
France is a further departure, because it displays not only a shift in the level of the BGP, like Japan, but also a change in the slope. After World War II France move up to a higher level of output per capita (the intercept of the dashed line rose) but also a higher slope, meaning the growth rate was permanently higher. Now, one can still argue that the two separate dashed lines represent BGP’s, but what France demonstrates is that the growth rate itself along a BGP could change. And if it can change for one country, why can’t it change for others?
Two colleagues of mine, David Papell and Ruxandra Prodan, wrote a paper recently that looked at the presence of BGP’s more formally. For 26 countries they look at whether their path of GDP per capita follows a strict BGP, meaning that over the 139 years of data there is no shift in the level or growth rate of GDP per capita. In essence, they are asking if those 26 countries have graphs that look like the one for the US.
For the US and Canada, the answer is yes, they have a strict BGP. But for the rest of the OECD and the other Asian countries they look at, the answer is no. Each of those countries has a distinct change in the level of GDP per capita (i.e. the intercept of their trend line shifts up or down) or a distinct change in the growth rate of GDP per capita (i.e. the slope of the trend line changes). Some, like France, exhibit changes in both.
The counter-argument to these figures is that yes, occassionally there are breaks in the level or growth rate, but in between these breaks economies appear to be on what looks like BGP’s. So it still is worth thinking about models that have BGP’s, because those will be useful in describing lots of the observed behavior in economies. And, models that have BGP’s also describe what sets the level and growth rate of GDP per capita, so we can use those same models to understand what could cause these distinct breaks we see at times in the data.
So let’s call this a qualified “Yes”, with some significant caveats, to the question of whether GDP per capita growth is constant over time.
Is the rate of return to capital constant over time?
The second Kaldor fact was a constant rate of return on capital. This was based on information from the UK and US. For the US, Kaldor relied on Kuznets who gave evidence that the return on capital was roughly 3 percent a year between 1919 and 1948.
Does the return on capital persist over longer periods of time? The issue with answering this is coming up with measures of the return to capital. For Kuznets, it was straightforward, take the share of output paid to capital (as dividends, rents, or interest) and divide it by the capital/output ratio. In other words, take total payments to capital (the share times output) and divide by capital.
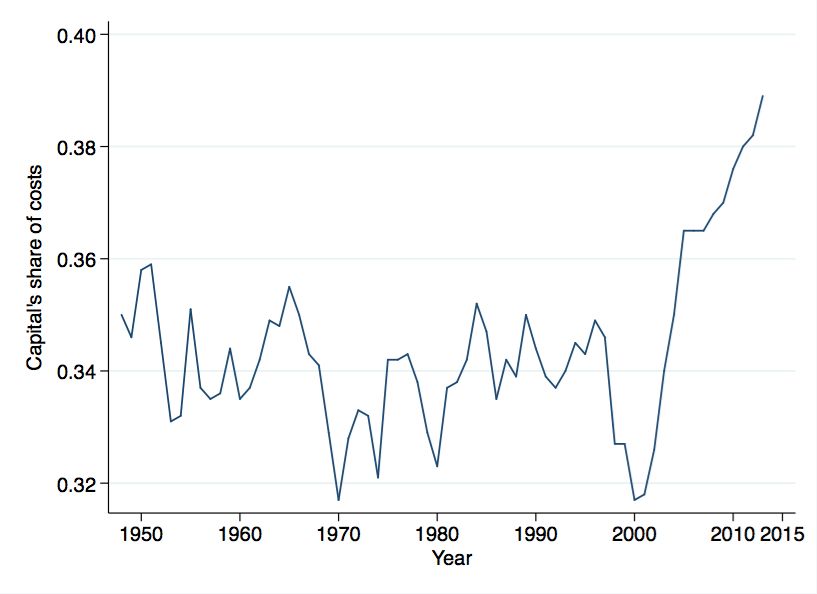
You can replicate this with newer data from the BLS. I posted something a while back on this very series, and the clear decline in the MPK over the last fifty years.
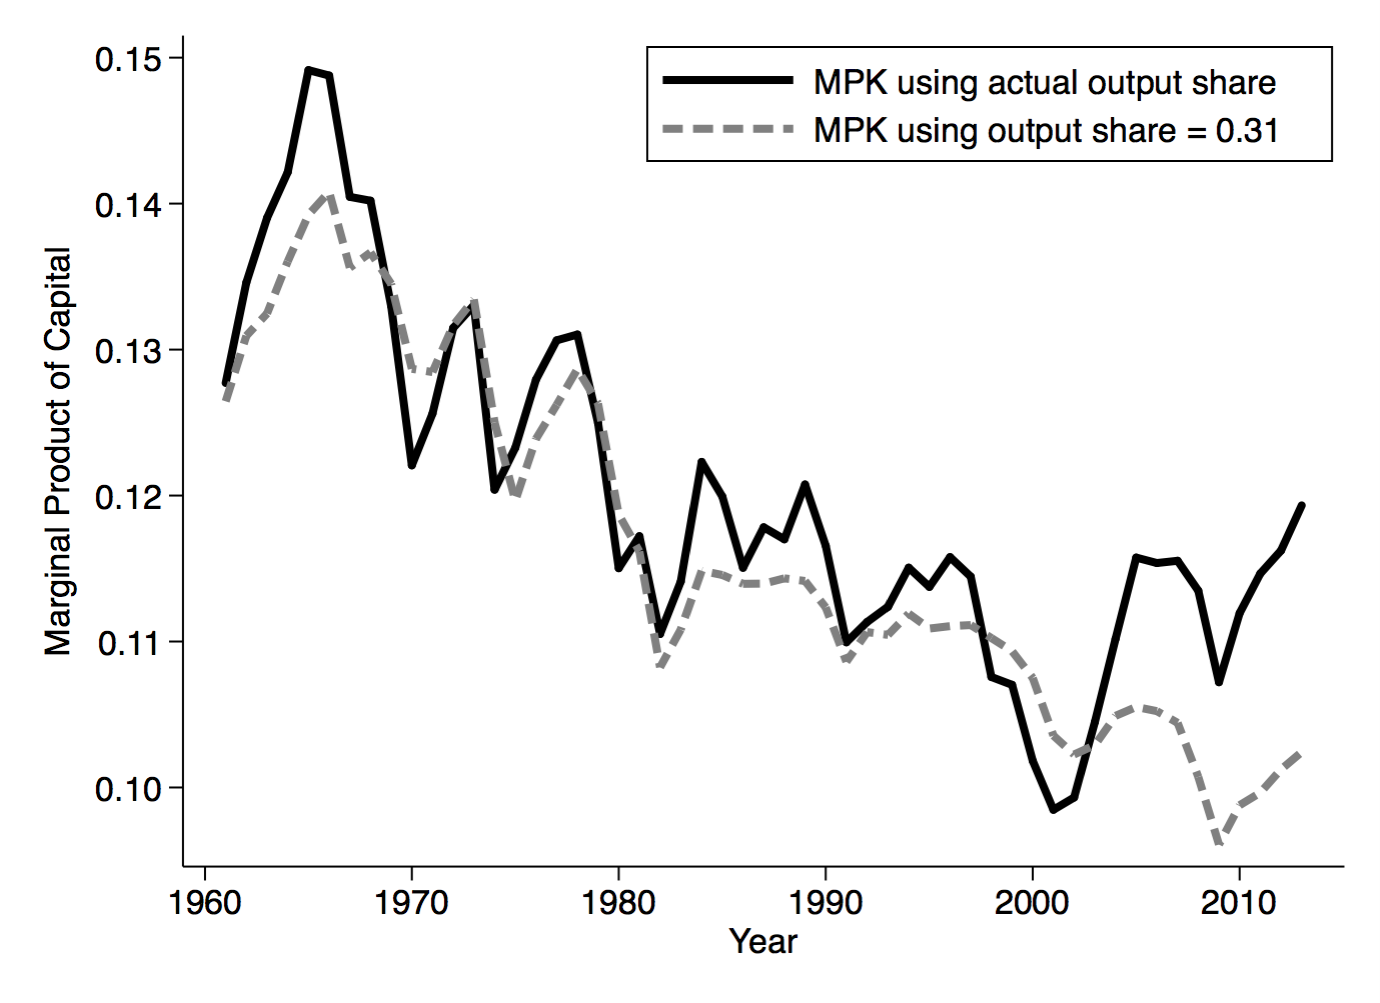
The two series in the figure differ in how I calculated the share of output going to capital, but the same story emerges regardless. There was a distinct decline in the return to capital over the post-war period. There is also a distinct level difference in the return with Kuznets. The BLS data indicate a return of 15%-ish in the 1960’s, and the decline still leaves the return at 10% currently, compared to Kuznets’ 3%.
Ok, maybe this isn’t the right way to measure the return to capital (although it is the way that any model of growth would measure it internally). Kuznets compared his return calculation to bond yields. I grabbed the seasoned corporate Baa bond yield from FRED as a comparison.
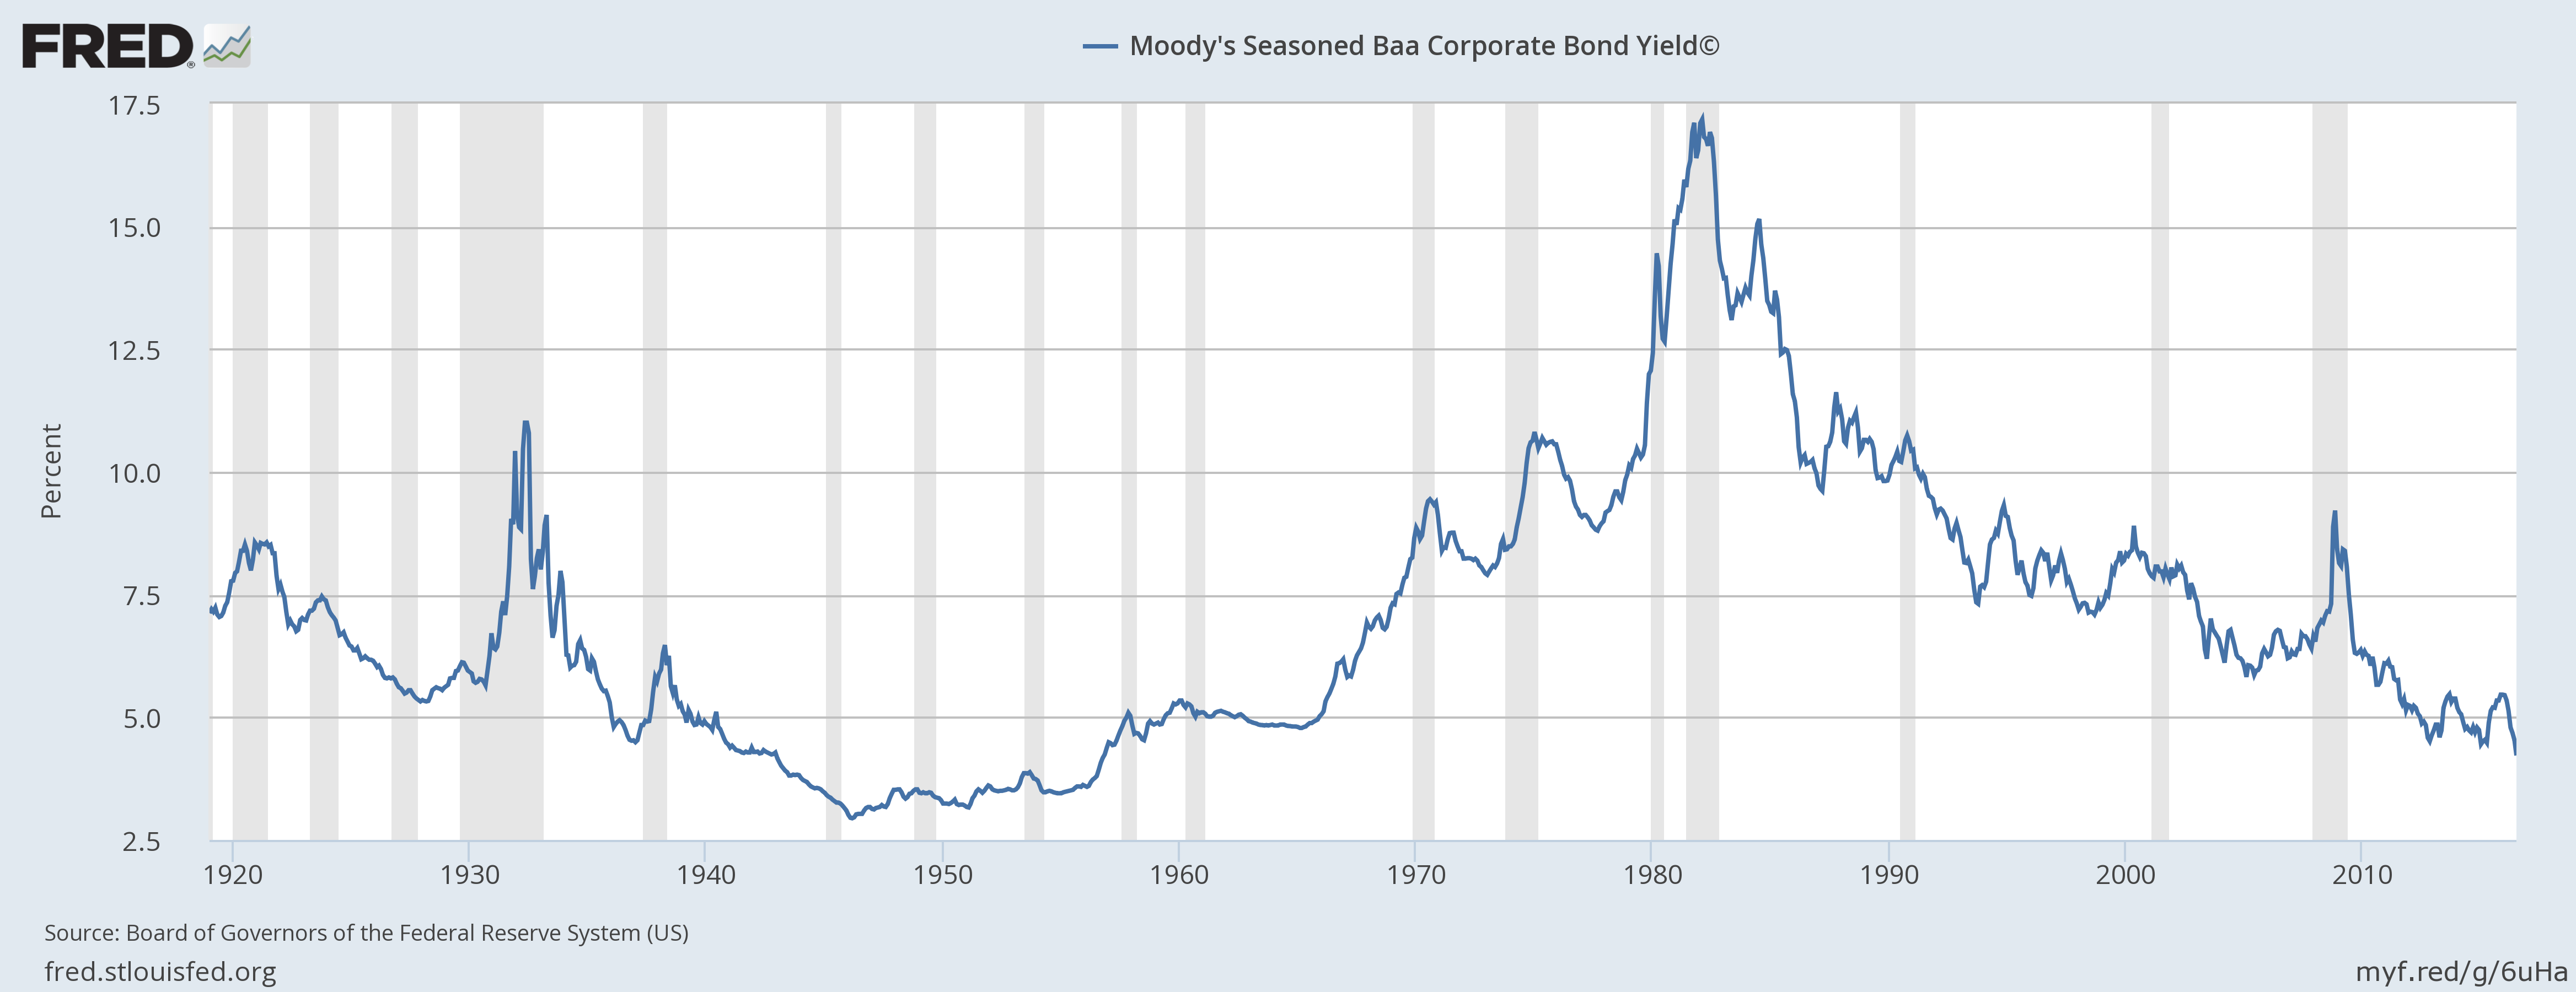
Again, it isn’t clear that this is constant. If you wanted to say there was a tendency for the corporate rate here to be about 5% over the long run, okay. But that 40-year deviation from 5% between about 1970 and 2010 seems like an abuse of the word “tendency”.
You have more luck with the S&P earnings yield, which perhaps we could think of as a better measure of the return to capital. I think I got this graph from a Brad DeLong post a while ago, but I don’t have the underlying data.
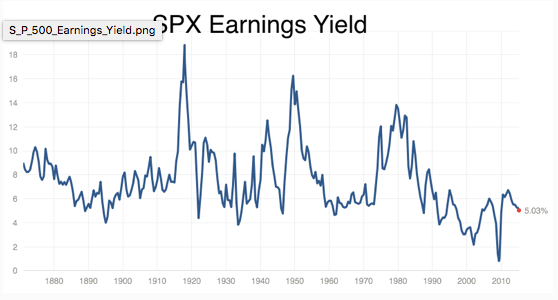
This travels around a lot as well, but it is easier to squint and see something that looks like a tendency to be around 6-8% over the long run, with a distinct dip in the recent few years.
Last, Piketty’s book contained a wealth (see what I did there?) of data on capital/output ratios, which are a key component of calculating the return to capital as in Kuznets. Here’s his plot of the capital/output ratio.
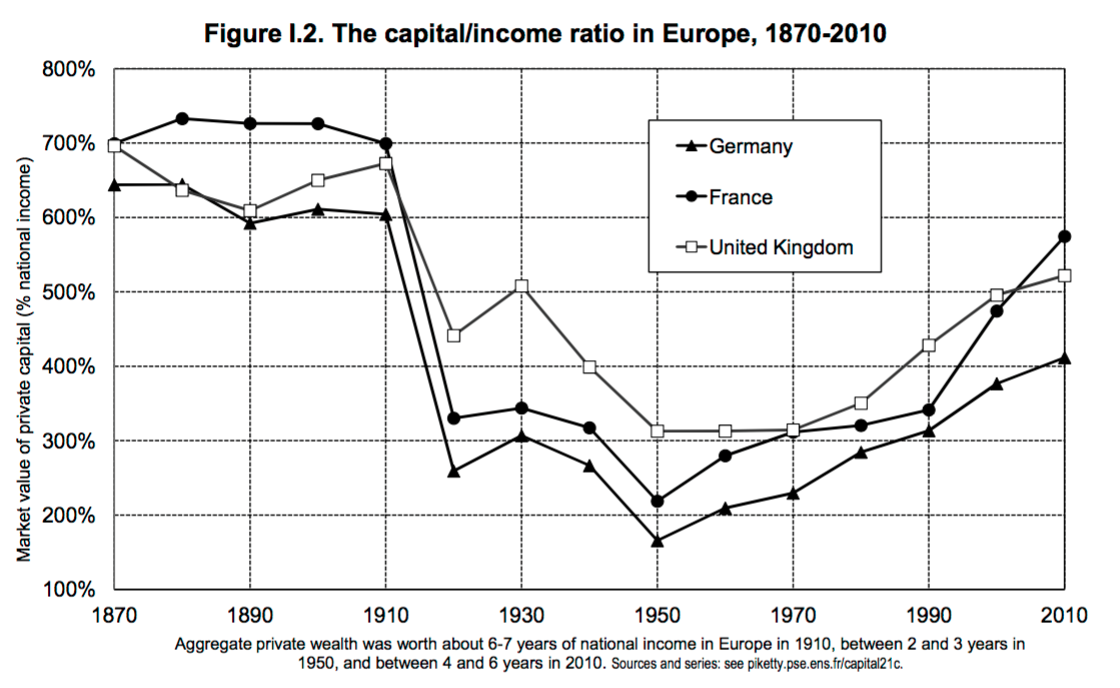
This obviously shows a lot of variation. And unless the share of output paid to capital changes demonstrably over time and in just the right way, this implies that the return to capital showed a significant amount of variation as well.
At the same time, Piketty’s evidence on the return to capital shows, at least for the UK, a remarkable stability over long periods of time.
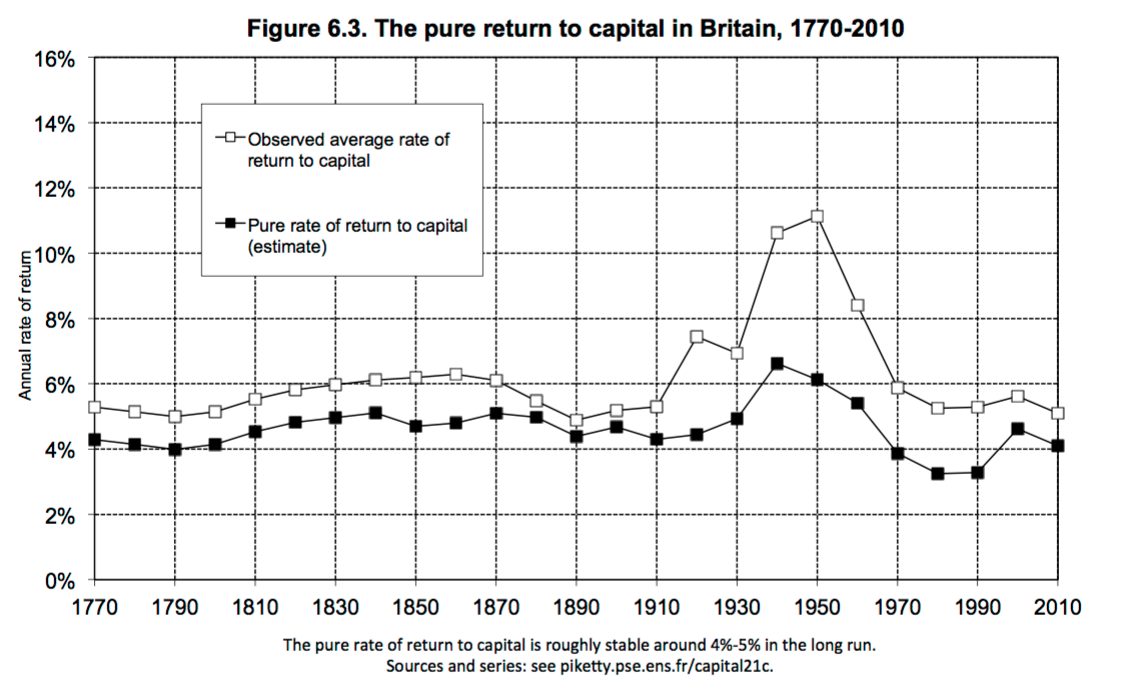
What is noticeable here is that it really is the post-war period that is an anomaly, and so maybe the US is in the same boat. Perhaps the decline in the rate of return I showed in the US MPK is just part of recovering back to this long-run flat trend like in the UK.
For France, the evidence is less clear about stability, but you can convince yourself, I think, that there is no distinct trend to the return.
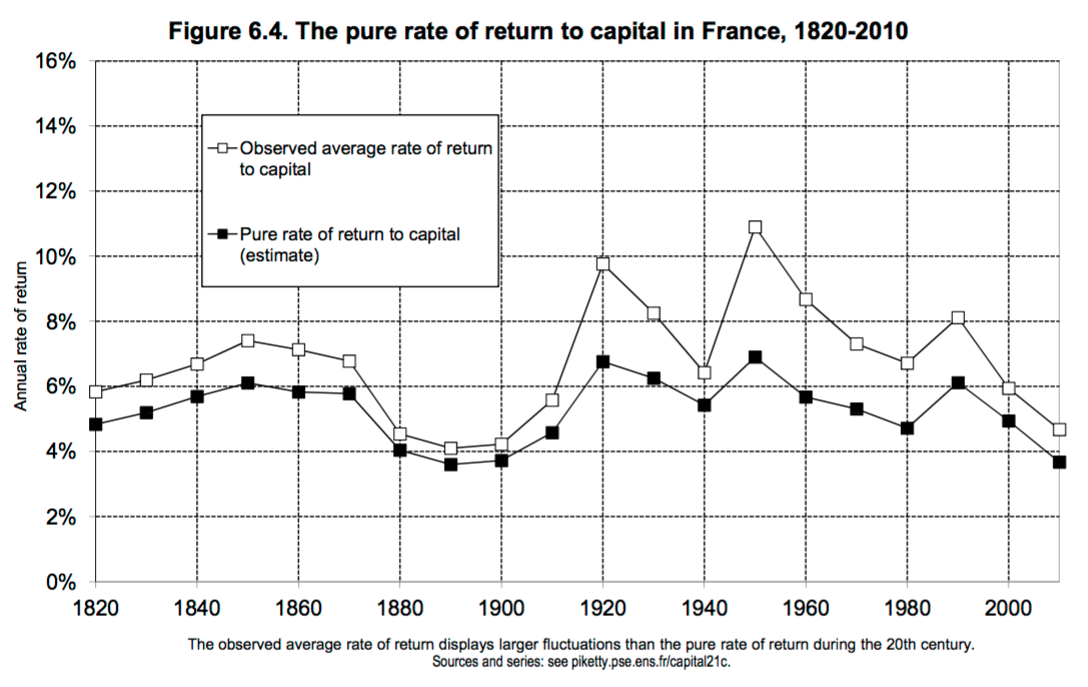
Overall, it isn’t obvious what to make of Kaldor’s fact regarding rates of return. Are there clear trends in rates of return? That depends a lot on the time frame you look at. For the US post-war, it sure looks like there is a downward trend. But for the UK and France over time, there are fluctuations but not a clear trend.
I don’t know that a qualified “Yes” is quite right. This seems like a weaker set of evidence than we have for the growth rates. It all appears to depend on the time frame you are talking about. So this one makes me nervous.
Is the share of output paid to capital constant over time?
Let’s stick with Piketty for the moment. Part of the story about returns mentioned above involved the share of output paid to capital. And Kaldor took as a fact that this share was roughly constant, or at least did not display a clear trend. Piketty has come data on these shares for several rich countries.
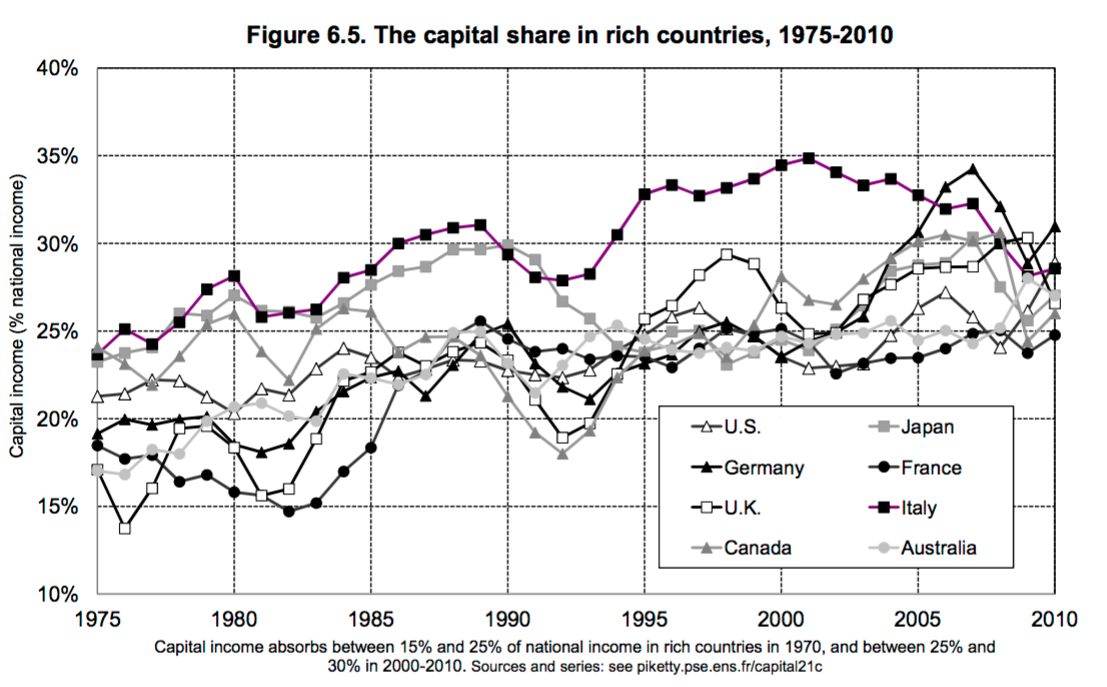
This looks as if the capital share is rising over the last 40 years for all these countries. I pulled BLS data for the US to go back farther, and you can see a similar story.
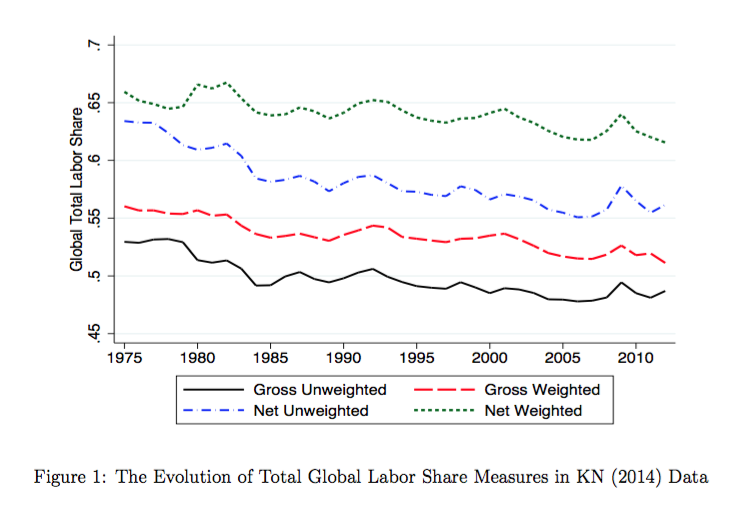
The inverse of this is the decline in labor shares. Karabarbounis and Neiman (working paper here) have investigated both if and why this is occurring. Grabbing a graph from their paper, you can see the decline.
So we’ve got something that suggests the capital share is not constant over time. Whether these deviations are temporary or not is unclear.
I’ll go back to qualified “Yes”, in the sense that we just can’t know if the recent increase in capital share is an anomaly or part of a longer-run trend.
Sooooooo?
Is it time to abandon the Kaldor facts on which the whole BGP concept rests? I think this is a case of asking what your null hypothesis is. If the null hypothesis is that the Kaldor facts are right, then I don’t think the evidence I’ve got in this post is sufficient to reject that null. Meaning, until we see some kind of crazy trend in the capital share, return to capital, or crazy movements in GDP per capita, we’d keep working with the Kaldor facts and the BGP as an organizing principle.
But if you started with a null hypothesis that there were no stylized facts about growth, as if you were Nicolas Kaldor but had all the data available now, would you feel like you could reject the null? That is, would you look at the figures I showed here and conclude that the growth rate of output per worker was constant over time, the rate of return was constant, and the capital share was constant? I’m not sure you would. Those were all qualified “Yesses”, and in some cases very qualified. If you started fresh today, you’d have to do a lot more work to convince people that those were decent approximations of reality.
The problem with the BGP paradigm is that it has become the default null hypothesis, and hence when you see the data above, you’re inclined to assume any deviations are temporary. Are we really looking at the data, or filtering it through our belief in the BGP idea?
What I’m going to do in the next post, which I hope will go up later this week, is work through some of the theoretical issues in the BGP concept. In short, by taking Kaldor’s facts as given, and forcing our models to have BGP’s, have we been forced to make other assumptions that do not make sense? And are we trying to hard to rescue our existing models, when maybe we should be trying out new ones?