One of the running themes on this blog is that productivity (called total factor productivity or multi-factor productivity by those in the biz) is basically a garbage dump for all the stuff we do not know how to measure in the real economy.
Today’s post provides another example of this. Alwyn Young published a paper in 2014 on the “cost disease of services” and productivity growth. In short, the cost disease of services is an idea from William Baumol, and it is intended to explain why productivity growth tends to slow down during a structural transformation from manufacturing to services. The idea is that services have low inherent productivity growth compared to manufacturing, mainly because services are often provided in fixed units of time (you can’t get a one-hour massage in less than one hour). Combine that with the fact that services are highly income elastic, meaning we demand more and more of them as we get richer, and labor moves into services over time. Hence the average growth rate of productivity falls because everyone is now working in this low-growth sector. It is certainly one of my leading candidates for an explanation of why productivity growth is relatively low in the last 15-20 years compared to prior periods of time.
Young’s paper questions whether in fact services really do have slower productivity growth than manufacturing. His argument is going to be that we may be falsely under-stating productivity growth in services because we are not accounting for the fact that the labor flowing into services is, compared to existing service workers, relatively bad at doing service work. What looks like low productivity growth is in fact low growth (or negative growth) in average human capital.
At the same time, productivity growth in manufacturing is over-stated because the workers that remains behind in manufacturing as people leave are only the very best workers, and hence the average ability of manufacturing workers (to do manufacturing work) is going up over time. What looks like high productivity growth is in fact high growth in average human capital.
The idea comes from the Roy model (1951), a classic economics paper about the distribution in earnings. At it’s heart, the Roy model is about self-selection. Imagine that each person has some built-in ability to work in manufacturing, and some built-in ability to work in services. There may be some elements of these abilities that are correlated (maybe you are really smart and could figure out how to do either efficiently), but regardless you’ll have a comparative advantage in one of them. Yes, the same idea of comparative advantage as in trade. You may be good at both activities, but relatively speaking you’ll be better at one or the other when I compare you to someone else.
Young works out an exact case of the Roy model where your comparative advantage is positively correlated to your absolute advantage. That is, people who are relatively good at manufacturing are also absolutely good at manufacturing. Let me be specific, because I know I always found these concepts hard to keep straight in my head. My daughter once took a few hockey lessons, but now has been swimming her whole life. She has a comparative advantage in swimming over hockey. I’ve played hockey for a long time, but I never really took swim lessons as a kid, and I’m always worried about losing my contacts in the water, so I know just enough to keep myself from drowning. My comparative advantage is in hockey.
But not only that, our absolute advantages are correlated with our comparative advantages. If we had a swim race, my daughter would win - absolute advantage matches comparative advantage. If we played hockey, I would win - absolute advantage matches comparative advantage. (This wasn’t true a few years ago. Despite my lack of swimming skill, when she was 7 I could still outswim her just because I was bigger. Not any more. But I can still own her on the ice.)
In the Roy model, if there was demand for one swimmer and one hockey player, my daughter would self-select into the swim sector and I would self-select into the hockey sector. Now, if the economy changes and the demand for hockey falls and swimming rises (global warming?), then I will have to switch. This will unambiguously lower the average skill level of swimmers, as I suck.
When comparative advantage and absolute advantage are correlated in a Roy model, any movement of a worker from one sector to another will lower the average skill of the receiving sector, and raise the average skill of the sending sector. If I get moved from hockey to swimming, I lower the average skill of swimmers. The dudes that remain in my hockey league will be the ones who are still better than me (i.e essentially all of them), and so I just raised the average skill level of my league by leaving.
This is the essence of Young’s story, and he shows that if this is how things work, then it has an effect on measured productivity growth in each sector. Just another example of how measured productivity growth is a garbage pile of all the things we don’t know how to keep track of.
In the past on this blog, I’ve referred to measured productivity growth as the “residual”, R, and true productivity growth as A. So to be consistent with the blog, but not with Young’s paper, he finds that
\[\hat{R}_j = \hat{A}_j + \xi \hat{s}_j\]where $\hat{R}$ is the growth rate of the residual productivity measure (what you see reported by the BLS) for sector j. So $\hat{R}_{Manuf}$ is the residual productivity measure for manufacturing, as an example. $\hat{A}$ is true productivity growth in sector j. $\hat{s}$ is the growth in the share of labor working in sector j.
$\xi$ is how average worker ability/skill responds to a change in sector j’s share of the labor force. Young establishes empirically that $\xi$ is less than zero. He has his own estimates based on using sector-level data from Europe and the US, and this is consistent with several other estimates drawn from the literature. These estimates come from regressing measured productivity growth, the $\hat{R}$ things from many sectors over many years, on measures changes in labor shares, the $\hat{s}$ things. An important element of this is that Young actually has these labor terms for 60 types of labor, differentiated by gender, age, and education. Thus his estimate of $\xi$ is not just picking up on the fact that perhaps manufacturing workers are older, male, and less educated, for example. It has to be mentioned here as well that Young’s estimates are very imprecise, with standard errors big enough that you cannot reject zero in many cases - his case is really made on the fact that the negative estimates are so consistent across different samples and specifications. So you could easily remain suspicious of these results pending some more precise way of nailing down the value of $\xi$.
The fact that $\xi$ is estimated to be less than zero implies that measured productivity growth in a sector goes down when more labor (of any of the types) is added to the sector. This is consistent with the theoretical case Young discussed within the Roy model of comparative advantage and absolute advantage being correlated. And now that we know $\xi$ is negative, we can see what kind of an effect the Roy effects have on measured productivity.
Take manufacturing, which has a shrinking share of labor, meaning $\hat{s}<0$ for that sector. Combined with $\xi<0$, this means that $\hat{R}>\hat{A}$ for manufacturing. Measured manufacturing productivity growth is higher than true productivity growth. Flip the logic around for services, where $\hat{s}>0$, and you get that $\hat{R}<\hat{A}$. Measured productivity growth is lower than true productivity growth.
Young provides a table where he recovers the true productivity growth rates in each sector. This depends on the value of $\xi$, and his estimates suggest that this parameter is somewhere between -0.5 and -1.0.
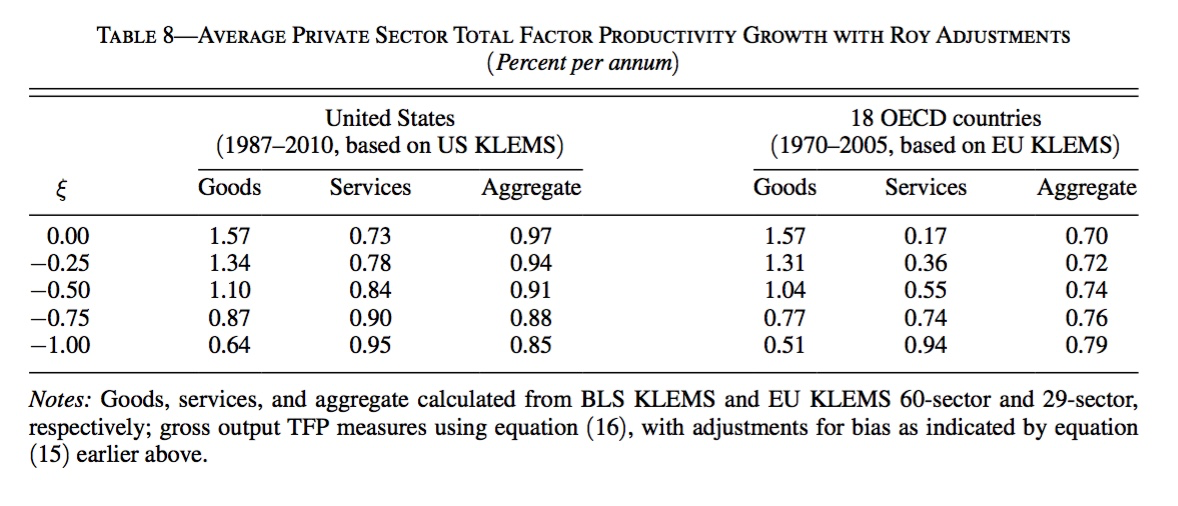
Looking at the table, the first row just gives the regularly reported values for productivity growth in the US and the EU for manufacturing and service productivity growth. In the US, manufacturing (goods) has reported productivity growth of 1.57 percent per year, and services only 0.73. However, if Young’s estimate of $\xi$ of -0.5 is right, then in fact true productivity growth is more like 1.10 in manufacturing and 0.84 in services. If -0.75 is right, then services have a small advantage at 0.90 percent per year, manufacturing has 0.87, and they are basically equal. You get a similar pattern for the EU, where manufacturing and services show similar productivity growth once the $\xi$ parameter is big enough in size.
This analysis suggests that perhaps Baumol’s story is wrong. Services may not have a built-in tendency towards slower productivity growth over time. Rather, we are measuring it wrong. Remember that residual productivity measures are junk piles, and what Young is suggesting is that service productivity measurement had a big load of crap dumped on it because of these Roy effects. Manufacturing does not necessarily have better productivity growth, because it also had a big load of crap dumped on it by the Roy effects. If you take Young’s work seriously, then he’s showing you that productivity growth across all sectors is roughly similar over time, and hence there is no need to worry about the shift from manufacturing to services.
Now, what Young doesn’t do is decompose his table by time periods, so we cannot examine the effects when aggregate produtcivity growth was large (the 90’s) and when it was small (the 10’s). Has the Roy effect gotten bigger or smaller over time, or is it unchanged? And these Roy effects don’t necessarily offer any explanation for the aggregate productivity slowdown we’ve seen in the last few decades. Note that adjusting for the Roy effects may make the true aggregate productivity growth rate go up (the EU) or down (the US). The best this table can do is explain that the slowdown wasn’t due to “Baumol effects” of moving into services. But that’s important, because it means that we are not somehow doomed to slower productivity growth just because we’ve moved into services. We’re doomed for entirely different reasons, apparently.
A few other notes about this paper. David Lagakos and Mike Waugh use this same concept to explain why there is such a large gap in productivity between agriculture and non-agriculture in developing countries, and why that gap tends to disappear as countries develop. And that makes me wonder about accounting for productivity growth rates in sectors in the early part of the 20th century, when agriculture was the shrinking sector and manufacturing was growing. Based on Young’s logic, this means we were probably over-stating agricultural productivity growth and under-stating manufacturing productivity growth. So perhaps Bob Gordon’s story of high mid-century productivity growth is even more extreme than I thought?
Last, if you want to learn how to write a lucid economics paper, read this one, or really any of Young’s work. It’s just so coherently organized and explained compared to the vast, vast, vast majority of what gets published.