Everyone loves talking about productivity, and how it doesn’t grow as fast as it used to. Very low productivity growth rates, in same cases negative, have been used very recently as evidence of this long-run slowdown and why perhaps it will get worse. But inferring something about long-run trends in productivity growth from a few years of data, especially years that represent a recovery from a deep recession, is probably unwise. Now that I have the 2015 BEA data on sector-specific output and employment, let me try to illustrate what I mean.
Productivity growth is just output (value-added) growth minus input (however measured) growth. In this post I’m working with BEA data on value-added and full-time equivalents, so when I say productivity that is short-hand for “value-added per full-time equivalent”, which some might refer to as a measure of labor productivity.
The point of the post is really just to point out that a notable feature of the slow growth in productivity in 2013 and 2014 was the incredibly rapid growth in full-time equivalents. Aggregate value-added growth did not drop off appreciably. Rather, the growth rate of full-time equivalents was high, and hence measured productivity growth was very low.
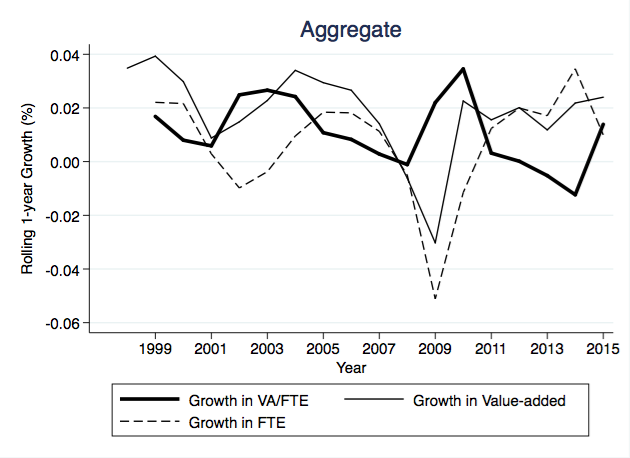
The figure shows the growth rate of productivity (value-added per FTE) as the thick black line, and then also includes the separate growth rates of value-added (thin gray line) and FTE’s (thin dashed line). What you can see in 2013, and in 2014 especially, is that productivity growth dropped to about -2% per year. But value-added growth was still about positive 2% per year, and the entire reason for the decline in productivity growth was that FTE growth was over 3%. Compare that to the numbers from the rest of the time period I plotted, and that is an exceptional number. Labor force growth drove the decline in productivity, purely from an accounting perspective.
In 2015, once the growth in FTE’s ebbs to only about 1%, and there is a slight uptick in the growth rate of value-added, we see productivity growth rise to positive 1%. It sure looks like the drop in productivity growth in 2013/14 was temporary and driven almost entirely by the acceleration of growth in FTE’s as the economy starts to recover.
Using the BEA data, I can dig backwards into the sector-by-sector contributions to productivity growth. And there are a few select sectors that appear to be driving this phenomenon. First, take a look at “Government”, which includes federal as well as state and local government spending.

The growth rate of value-added declines noticeably from 2008 to 2013 before experiencing a slight uptick in 2014 (the light gray line). The growth rate of FTE’s in government also bottoms out in 2011 at about -1.5%. After that, the growth rate recovered, and by 2014 FTE’s in government were growing at 1% per year. As long as FTE’s are growing faster than value-added, productivity growth will be negative, and you can see the precipitous drop in productivity growth for government in the 2013/14. In 2015, with a smaller growth rate of FTE’s in government, productivity growth recovers closer to zero, but is still negative.
One side note about “value-added” for government. This is going to include both salaries for public employees like teachers, cops, and fireman, and also capital spending like roads, bridges, and other infrastructure. The effect you see in the overall government sector is driven almost entirely by state and local governments. They shed workers like crazy after the recession, and in 2014 that reversed dramatically. Growth in state/local FTE’s went from -1.5% in about 2011 to +2% in 2014.
Retail is another sector with a dramatic acceleration of the FTE growth rate in 2014, illustrating this point. In this case the discrepancy between value-added growth (consistently around 2% per year) and FTE growth in 2014 (pushing 15%!) is very stark. The massive addition of labor to retail in 2014 explains everything about the massive negative growth rate of productivity in retail, about -11%. And as retail work makes up about 20% of aggregate FTE’s, this negative growth rate of productivity puts a big drag on aggregate productivity growth. In 2014, the negative growth rate of retail productivity can essentially explain all of the negative growth in aggregate productivity in the same year. But this is all due to the massive expansion of employment.
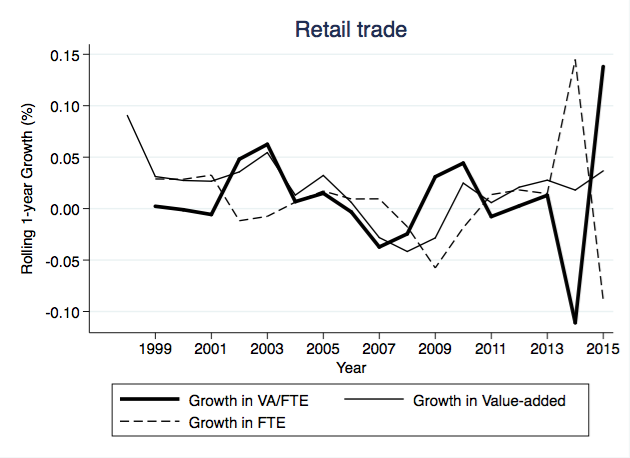
In 2015, with the reversal of FTE growth (-10%), productivity growth bounces up to positive 12%, which means it contributes about 2.4 percentage points to aggregate productivity growth. But these fluctuations are entirely due to the fluctuations in the FTE growth rate in retail. Note that growth in value-added remains roughly constant in these last few years.
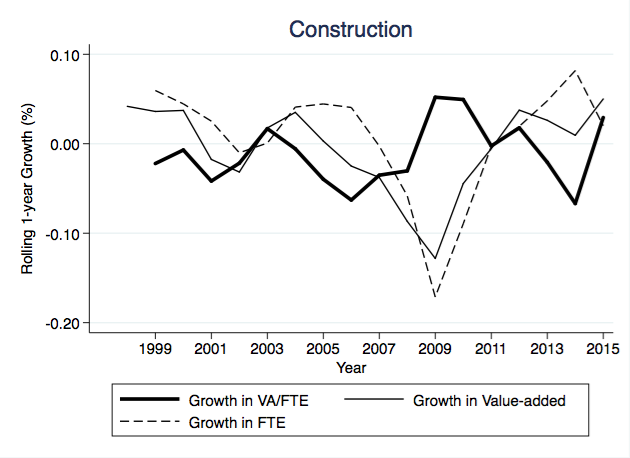
The one other sector with a pattern is construction. Again, productivity growth is negative in 2014 (and 2013), but this is driven almost entirely by the higher growth rates of FTEs in construction in those years. In 2015, as FTE growth abates in construction, productivity growth looks positive again.
Other sectors have this effect present, but it looks pretty small (Manufacturing, Utilities, Wholesale trade). Some, like transportation and mining, have similarly large shifts in FTE’s, but these tend to act in the opposite direction to those in retail and construction. That is, in 2013/14, the growth in FTE’s was negative, and so calculated productivity growth was very positive. In 2015 recovery in the FTE growth in both sectors is associated with much lower productivity growth, as in both cases value-added growth doesn’t change a lot.
One response to these figures is that this reflects some error in calculation or reporting. And believe me, I’ve gone back and forth with the BEA website to confirm that this is really what they are reporting for 2014 and 2015, and that I’m using the right data. I’ve picked over my Stata code a few times to see if I’m getting this wrong somehow, but this is what the data say. If I was calculating things wrong, you’d expect to see some other odd surges in growth rates in other years, at least for some sectors. And since we don’t, I believe I’m accurately reporting the right growth rates given the BEA data provided.
So on the assumption that these figures are a good representation of what was going on with productivity growth, what does it tell us? The first reaction I have is that this is precisely why you shouldn’t get worked about a single year’s productivity growth rate. In 2014, it was negative in the aggregate thanks in part to retail and government as well as several other sectors. But given that this was driven entirely by a surge in FTE growth associated with a recovering labor market, I don’t know that there is any long-run information here. It certainly doesn’t provide any evidence that innovation is slowing down. Productivity is just a residual, so short-run productivity growth rates will always be subject to surges in short-run FTE growth.
A second reaction may be, if these industries are adding all these FTE’s, then why isn’t value-added rising faster? Does this make sense for firms to hire these people (or raise their hours) if they are not getting more value-added? Perhaps the people they are hiring are relatively low-skill and low-productivity? Think of the Roy model idea I mentioned in a recent post about Alwyn Young’s recent paper. If the people who are being added are relatively bad at working in their sectors - because all the good people already work there - then putting them to work may not boost value-added growth.
If you were feeling optimistic, you might look at this as evidence that innovation is occurring. Perhaps firms have been adding labor quickly because they anticipate needing them over the next few years due to innovations coming on-line. They presumably are somewhat forward-looking, and so maybe this represents firms investing in building up a labor force in anticipation of new markets and new customers? Note that the drop in FTE growth in 2015 does not wipe out the FTE gains of the prior two years. FTE’s are still growing at the aggregate level in 2015, just at a slower rate. For Retail, FTE’s actually did fall in 2015 relative to 2015, but are still higher than in 2013.
Whatever you might take away regarding innovation, these graphs suggest that perhaps the drop in productivity growth in 2014 was really an aberration. If FTE growth returns to more typical rates, then productivity growth - remember, just a residual - would return to more typical rates as well. And just a note, this doesn’t provide an explanation for why long-run productivity growth has been lower over the last few decades, but simply an explanation for why very recent productivity growth looks weak. I think the message is to not get hung up on year-to-year productivity growth rates.