Nick Bloom, Chad Jones, John van Reenen, and Michael Webb have a new paper on how productive we are at producing “ideas”, which one can argue are the ultimate source of all economic growth.
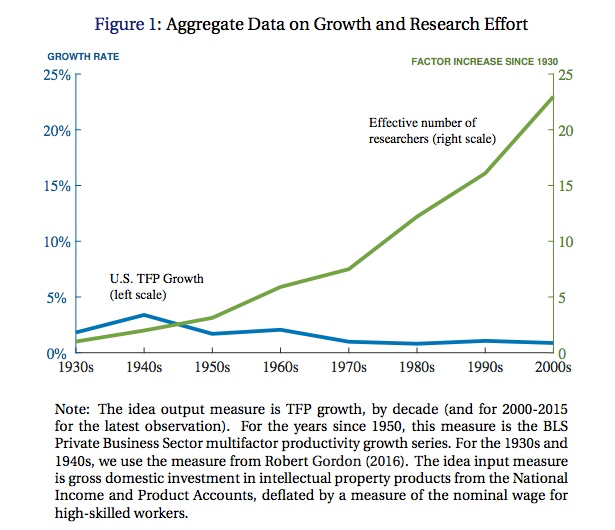
The splash graphic from the paper, which I believe made a brief tour of the Twitter-verse a month or so ago, is shown below. It shows that the TFP growth rate (in blue) peaked around the 1940’s, and has declined since then. The axis measurement here is a big funky, as you could see more of the details of this line if they had made the left axis go up to say 5%, rather than 25%. Regardless, the TFP growth rate is smaller than it was in the past, following Robert Gordon’s numbers.
In green is the relative number of researchers compared to the number in 1930. This isn’t the number of researchers, its a measure of effective researchers, found by dividing total R and D spending by the nominal wage of high-skilled workers. Relative to 1930, we have almost 25 times as many (effective) researchers at work today. This leads to the author’s title question - “Are ideas getting harder to find?”. And the author’s answer is “Yes”.

Measuring Idea TFP
BJvRW measure how “hard” it is to find ideas by looking at what they call “idea TFP”. This is easy to back out from some data. Let’s write the growth rate of ideas (I) as
\[\frac{\dot{I}_t}{I_t} = \alpha_t S_t\]where the left side is the growth rate of ideas at time t, and on the right-hand side we’ve got the determinants of that growth. $S_t$ is research effort, and here think of the measure of effective researchers. How much work do we put into coming up with new ideas? The second term is $\alpha_t$, which is the “idea TFP”. It tells you how much idea growth you get out of those researchers.
If you tell me the growth rate of ideas (the left) and the number of effective researchers (S), then I (well, the authors) can back out the measure of $\alpha_t$ year by year. And this is what BJvRW do, in a variety of contexts.
What they do first is to equate the growth rate of ideas with the growth rate of TFP (actual aggregate TFP in producing GDP). That doesn’t mean that each idea is equal to one “unit” of TFP, it just means that if the number of ideas grows by 10%, then TFP grows by 10%. This is a big leap - but let’s not get hung up on this. It isn’t important in this first context. With the data from the first graph on the TFP growth rate ($\dot{I}/I$), and the number of effective researchers ($S_t$), we can back out $\alpha_t$. This “idea TFP” is, awkwardly, the “TFP TFP”, or our productivity at producing TFP given a set of researchers.

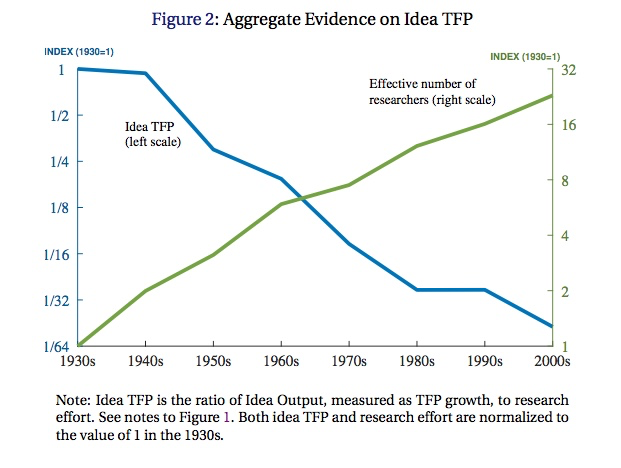
This second graph plots the $\alpha_t$ they back out, relative to 1930. You can see that it falls to about 1/64th of the level in 1930. Because we are 1/64th as effective at turning researchers into TFP, but we only have 32 times as many researchers, our growth rate of TFP is about 1/2 as high as it was in the 1930’s/1940’s. Hang on to the “why” question for a moment. For now, we’re just looking at the pure accounting.
This first exercise using (actual) TFP as the measure of ideas is a bit crude, and what BJvRW go on to do is examine individual industries or types of products to establish that the “idea TFP” is in fact falling within each of these as well. This is relevant because the first result using TFP does not tell us what is happening at the “micro” level. We could have constant (or even rising) “idea TFP” within individual industries or lines of research, and yet in aggregate falling “idea TFP”. It may be that ideas are not perfectly translated to TFP, or it may be that the we are spreading our research efforts over an ever-expanding list of industries or lines of research. In the latter case, idea growth in individual industries/lines may be falling because of the decline in numbers of researchers, not because of declining idea TFP. But in aggregate, this would look like declining idea TFP.
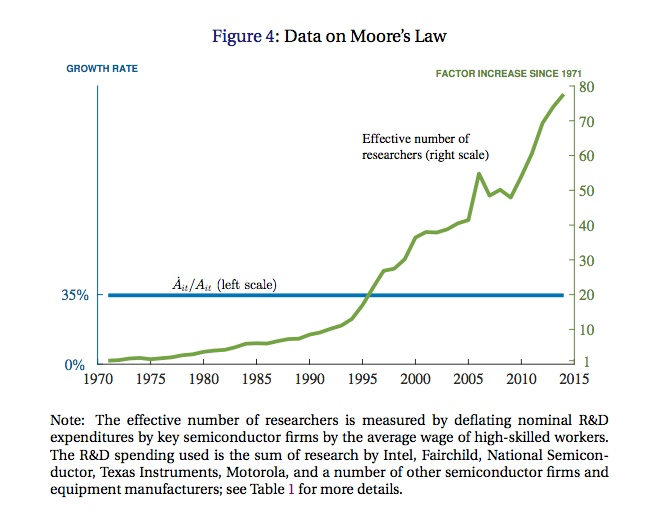
Thus looking at individual industries/lines will help us sort out what is happening. The first example is transistors, and the count of transistors per square inch on a chip. Famously, this appears to obey Moore’s Law, which is that the number of transistors per square inch doubles every 18 months. If we count the number of transistors per square inch as “ideas”, then this translates to a growth rate of 35% per year. At the same time, the effective number of researchers working at chip companies (Intel, AMD, etc..) has grown by a factor of about 80 since 1970. Plotting this together yields their next figure.

Relative to the first graph, there is no decline in the growth rate of transistors. But there also isn’t an increase, despite the increased number of researchers. What this means is that “transistor idea TFP” is falling over time, at about 10% per year. As they point out in the paper, Moore’s Law still holds, but it takes 78 times more researchers to figure out how to double transistor density than it did in 1970.
From here, the paper works through several other examples. I’ll leave it to you to look at the specifics. But overall, the message becomes clear. For crop yields, idea TFP is falling at between 3% and 9% per year, except for cotton, where it rose slightly over time. For “new molecular entities” (e.g. drugs) idea TFP has fallen to about 1/4 of its value in 1970, or about 3% per year. BJvRW also look at firm size, measured in different ways, which should be related to their productivity (and ideas). In each case, their size is not growing as fast as their RD spending, implying their idea TFP is falling at about 8-15% per year.
Implications for Economic Growth
The looming question here is whether this implies economic growth is due to slow down to zero. And the answer is “No”. It is possible for ideas to have a constant growth rate (and GDP per capita to have a constant growth rate as well) even if idea TFP is falling over time. For “semi-endogenous growth theory”, a term often associated with Chad Jones, this falling idea TFP is consistent with constant, positive growth in GDP per capita.
This is what is in the Jones/Vollrath textbook (buy 1, buy 10, buy 1000!) when we teach how ideas accumulate. Modify that first equation I showed you to look like the following
\[\frac{\dot{I}_t}{I_t} = \frac{\alpha}{I_t^{\beta}} S_t.\]where idea TFP is now the ratio of a constant, $\alpha$, and the number of ideas, $I_t$, raised to the power $\beta$. The value of $\beta$ is quite important. If $\beta=0$, then the level of ideas has no effect on idea TFP, and idea TFP should be constant. This is what was in the original Romer model, by the way. What Jones did was to say that this implies a very knife-edge condition, and there was no reason to assume that $\beta=0$. When $\beta>0$, as we accumulate more ideas, the growth rate of ideas falls - idea TFP goes down.
But just because idea TFP falls as we get more ideas doesn’t mean the growth rate of ideas (the left hand side) is falling. Why? Because $S_t$ is rising over time due to population growth. If the share of people working as researchers is constant, then their absolute number is rising over time. In that case, there is a growth rate of ideas such that the growth rate of ideas stays constant over time, $\dot{I}/I = n/\beta$, where $n$ is the growth rate of population (and hence of researchers). Idea growth need not slow down just because idea TFP falls over time.
Hence the “don’t panic yet” comment in the title. Falling idea TFP may well be the natural course of things, without resulting in lower actual TFP growth. The observed fall in actual TFP growth would have to come from some other forces involved in generating research effort. Start with an explanation that might imply a permanent fall in the TFP growth rate:
- The growth rate of the effective population has fallen. If the population that provides researchers (and it is best here to think of the total population of advanced countries, not just the US) starts to grow more slowly, then S grows more slowly, and the long-run growth rate of ideas is going to be lower. Maybe the slowdown in TFP growth is due to slower population growth in developed countries. A counterargument would be that this is offset by the increasing shares of Chinese and Indian populations that are in the pool of possible researchers. A counter-counterargument would be that age distributions matter too, and we’ve got too many stodgy old people, and not enough inventive young whipper-snappers.
Other explanations might imply that the drop in the TFP growth rate will be temporary:
- A downward shift in the share of that population that is doing research. This would generate a lower measured short-run growth rate of ideas because S would have a lower short-run growth rate for a while as we moved to a lower share of people doing research. This doesn’t appear to be true in the data, where an increasing share of workers are reported as doing RD work over time - and that should be pushing up the short-run growth rate of ideas.
- An exogenous drop in the level of $\alpha$. In this case, the growth rate of ideas would eventually rise back up to what it was before, after we had lower measured TFP growth for a while on our way to a new equilibrium. If we’re going to argue about the value of $\alpha$, though, then we should start over with our theory about how ideas get generated, as saying “it was a random exogenous shock” ends up being kind of useless.
And of course, maybe semi-endogenous growth theory is wrong. Maybe this just isn’t the way to look at things. Alternative theories might say idea growth could be affected by policies (subsidies for basic research, tax policy regarding treatment of RD spending, etc..) and what we’ve seen is a continuous deterioration of the policies supporting idea generation. This one is a little hard to square, though, just because it seems odd that there would be such growth in the number of researchers if the returns to that research at the firm or individual level were going down so much. I can see how taxes on RD would lower the resources devoted to it, but why would that affect how effective RD efforts are? You’d have to argue that policies were incenting companies to work on useless ideas.