I’ve got a new working paper out (pdf or repec), co-authored with Ryan Johnson, on Malthusian constraints. There is some material that we’re cutting from the paper, because it is already getting too long, but I kind of like the graphs and the results, so I figured I would write them up here. Fair warning: there will be some math.
In the post I wrote not too long ago on what “Malthusian” means, I said that a key feature of a Malthusian economy was that living standards are inversely related to population size. Typically, we’d think of this as being due to fixed (or very expensive to acquire) amounts of agricultural land. What Ryan and I are trying to figure out is exactly how sensitive living standards are to population size.
This is related directly to the elasticity of agricultural output with respect to land. That is, by what percent does ag output go up if I increase the supply of land by 10%? Now, I just said you cannot change the supply of land, but that doesn’t mean we cannot think about a hypothetical where you could. So what Ryan and I do in the paper is try to estimate that elasticity very carefully.
To see the logic, and how we get there, let me lay out a little math. Agricultural production is given by
\[Y = A X^{\beta} L^{1-\beta}\]where A is productivity, X is the amount of land, and L is the number of people. The value of $\beta$ is the elasticity I was talking about. If you divide both sides of this equation by L, you get an expression for output per worker (i.e. living standards) of
\[Y/L = A (X/L)^{\beta}\]which says that living standards depend inversely on population size, L. That’s the Malthusian assumption. What this expression also says is that the elasticity of living standards with respect to L is equal to $\beta$.
I think this fairly intuitive. $\beta$ tells us how important land is for producing food, relative to labor. If $\beta$ is close to one, then land is the only thing that matters. It’s as if the land produces a fixed amount of food every year, regardless of how much work we put in. In that case, adding extra people reduces living standards by a lot, because there is no extra food to go around.
If $\beta$ is close to zero, then land doesn’t matter much at all. Most of what drives food production is the effort of the workers. In that case, if we add population, living standards only fall by a little, because each new person is able to produce a lot of extra food.
In the paper, we refer to an economy where $\beta$ is large as having “tight Malthusian constraints” because living standards are very sensitive to the number of people. In constrast, an economy with a a low $\beta$ has “loose Malthusian constraints” because the number of people doesn’t affect living standards by much.
To figure out the size of $\beta$, we do the following. Think of a bunch of economies with a similar living standard, so Y/L is a constant, and call that $\overline{y}$. Then rearrange the equation for living standards above to be
\[L/X = \frac{A^{1/\beta}}{\overline{y}^{1/\beta}}\]This says that population density will be high where productivity, A, is high, holding constant living standards. But notice that the strength of this relationship depends on the size of $1/\beta$. In areas with “tight” Malthusian constraints, and high $\beta$ values, the sensitivity of population density to productivity should be low. Because land matters a lot to production, the population gets spread evenly over all the land available, even if that land has fundamentally different productivity levels. If everyone tried to crowd into the highest productivity place, they’d drive down living standards by a lot. We should see similar population density across places with different inherent agricultural productivity levels.
In places with “loose” Malthusian constraints, the opposite logic holds. The sensitivity of population density to productivity will be high. Everyone can crowd into the small area of land with the best natural fertility, and living standards remain high, because living standards aren’t very sensitive to the size of the population.
Using a slightly more complicated setup, this is the logic that Ryan and I use to estimate the size of $\beta$. We look at how the density of rural population is related to measures of inherent land productivity, and we do that for districts within states (i.e. compare all the counties in Texas to one another), using data from all around the world.
But we can also do this a little more loosely using historical data on the density of population by country, and this analysis isn’t going to fit in the paper. What we do is take the data from the paper by Quamrul Ashraf and Oded Galor that I mentioned in the Malthusian post, which establishes that population density in 1500CE is positively related to productivity across countries, just as the last equation predicts.
Those guys, though, threw all the countries in the world together to do their analysis, and what Ryan and I did was look at the relationship of density and productivity in their data for specific regions, like Europe, Africa, etc.. Here’s the graph showing what we found.
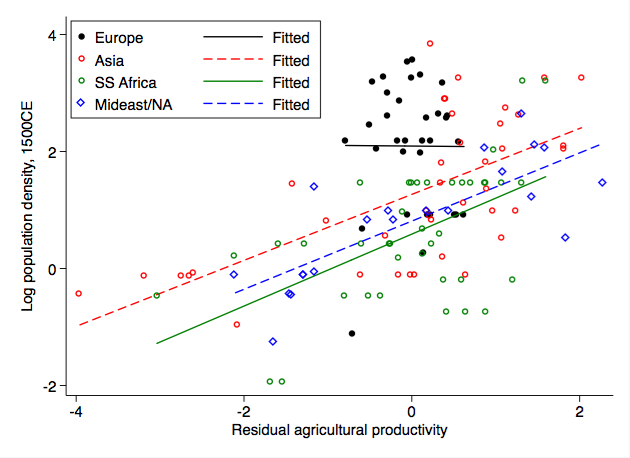
The “residual agricultural productivity” term on the x-axis is variation in agricultural productivity after we controlled for all the other things that Ashraf and Galor control for (latitude, etc..). Agricultural productivity is an amalgam of things related to how much of a country is suitable for cultivation. It’s based on climate characteristics and the like.
You can see that Europe looks a lot different than the other three regions plotted: Asia (really South and Southeast Asia), Sub-Saharan Africa, and the Mideast/North Africa. For Europe, there is no distinct relationship between density and productivity. This, using the logic I laid out above, says that the land constraint in Europe was very “tight”, with a high $\beta$. If you take the math seriously, it says that $\beta$ is approaching infinity, as the slope of the line should indicate a value of $1/\beta$. That is probably wrong, and is one of the reasons we like our district-level data for this job instead. Regardless, compared to the other regions, Europe looks like a place where living standards were very sensitive to population size. The other regions show a higher slope, indicating that more productive places were a lot more densely populated, and that is consistent with “loose” Malthusian constraints. Their living standards were apparently less sensitive to population size.
The difference in the average level of density (i.e. all of Europe’s dots are shifted up compared to the other regions) is capturing other unobserved “stuff” about Europe that just made it have high population density. For our purposes this shift isn’t as interesting as the relationship within each region.
Okay, great, Malthusian constraints were tighter in Europe than in other regions historically. So what? To see the importance, let’s go back to the relationship of living standards, Y/L, with productivity and land, and realize that there is more to life than food. That is, Y/L is my little model here is agricultural output per person in agriculture. For lots of historic economies, nearly everyone is in agriculture, and food is a massive share of what they consume, so just talking about “output” and “population” is fine. But to see the influence of constraints on development, we can be a little more subtle.
Let’s be specific that we’re talking about agricultural output per agricultural person, so
\[Y_A/L_A = A (X/L_A)^{\beta}\]And now, let N be the total population, which includes both agricultural workers, $L_A$, and non-ag workers (e.g. urban dwellers, etc..). I’m going to multiply and divide the left-hand side by N, and do some re-arranging of this equation. You can check my work, but I’m pretty sure this holds up
\[\frac{Y_A}{N}\left(\frac{N}{L_A}\right)^{1-\beta}\left(\frac{N}{X}\right)^{\beta} = A.\]On the right is just productivity. The left side tells me what I can do with that productivity. If productivity goes up, for whatever reason (i.e. the Glorious Revolution! The Columbian exchange! The Pope bans consanguinous marriages! Horse collars are invented! Someone planted turnips!) I can translate that into any or all of three things: increased food per person, $Y_A/N$, increased population per agricultural worker, $N/L_A$, or increased population density, $N/X$.
Note that $\beta$ features here in the trade-off between increasing population per ag worker or population density. In places with “tight” constraints, where $\beta$ is large, a small increase in population density would “eat up” the productivity gain very quickly. At the same time, because $1-\beta$ is small, it takes a big increase in the population to ag worker ratio (i.e. urbanization) to “eat up” the productivity gain. A tight Malthusian constraint makes urbanization relatively cheap compared to increasing density. The opposite logic says that a loose Malthusian constraint makes density relatively cheap compared to urbanization.
Hence places with tight contraints, like Europe, may have had a built-in advantage in development, even if they didn’t have an advantage in productivity, A. It could be part of the explanation for why Europe took off relative to the rest of the world, given that other areas had high productivity levels and productivity growth at least during some periods of their history.
That’s a lot to load onto one figure and a couple of equations. Ryan and I think we do a good job in the paper of establishing that the differences in $\beta$ across regions of the world are robust, and those differences appear related to underlying geographic characteristics (i.e. Malthusian constraints are tighter where winters are colder). The implications of those differences are harder to get at, of course, but we think there’s a plausible story floating around in there somewhere.
The application of this isn’t confined to historical development, either. For current developing countries, the tightness of the Malthusian constraint dictates the relative cost of urbanization versus density. We find very loose land constraints in tropical areas of Sub-Saharan Africa and Central America, perhaps offering some clue as to why they fell behind areas like East Asia, despite having similar starting conditions in the mid 20th century.