You know how when you get older, time seems to move faster? Well, imagine how that feels, and now pretend that you write a blog. It’s been about six months since I last posted something, and that was not a conscious decision, but just something that kind of happened as I kept putting it off while I worked on classes or research. If I want to blame something in particular, I have been helping to coach my kids lacrosse team for the last few months, and you’d be shocked at how much mental real estate U-12 lacrosse eats up.
Whatever the reason, I’m back. And it was a working paper that I finally got around to reading that prompted me to get back on the wagon. Jane Humphries and Jacob Weisdorf have put out “Unreal wages? Real income and economic growth in England, 1260-1850”, which you can find an ungated version of here. As they set it out, there is a disparity in the data sources we use to think about the timing and evolution of sustained economic growth. The basic problem can be see in their figure, reproduced below.
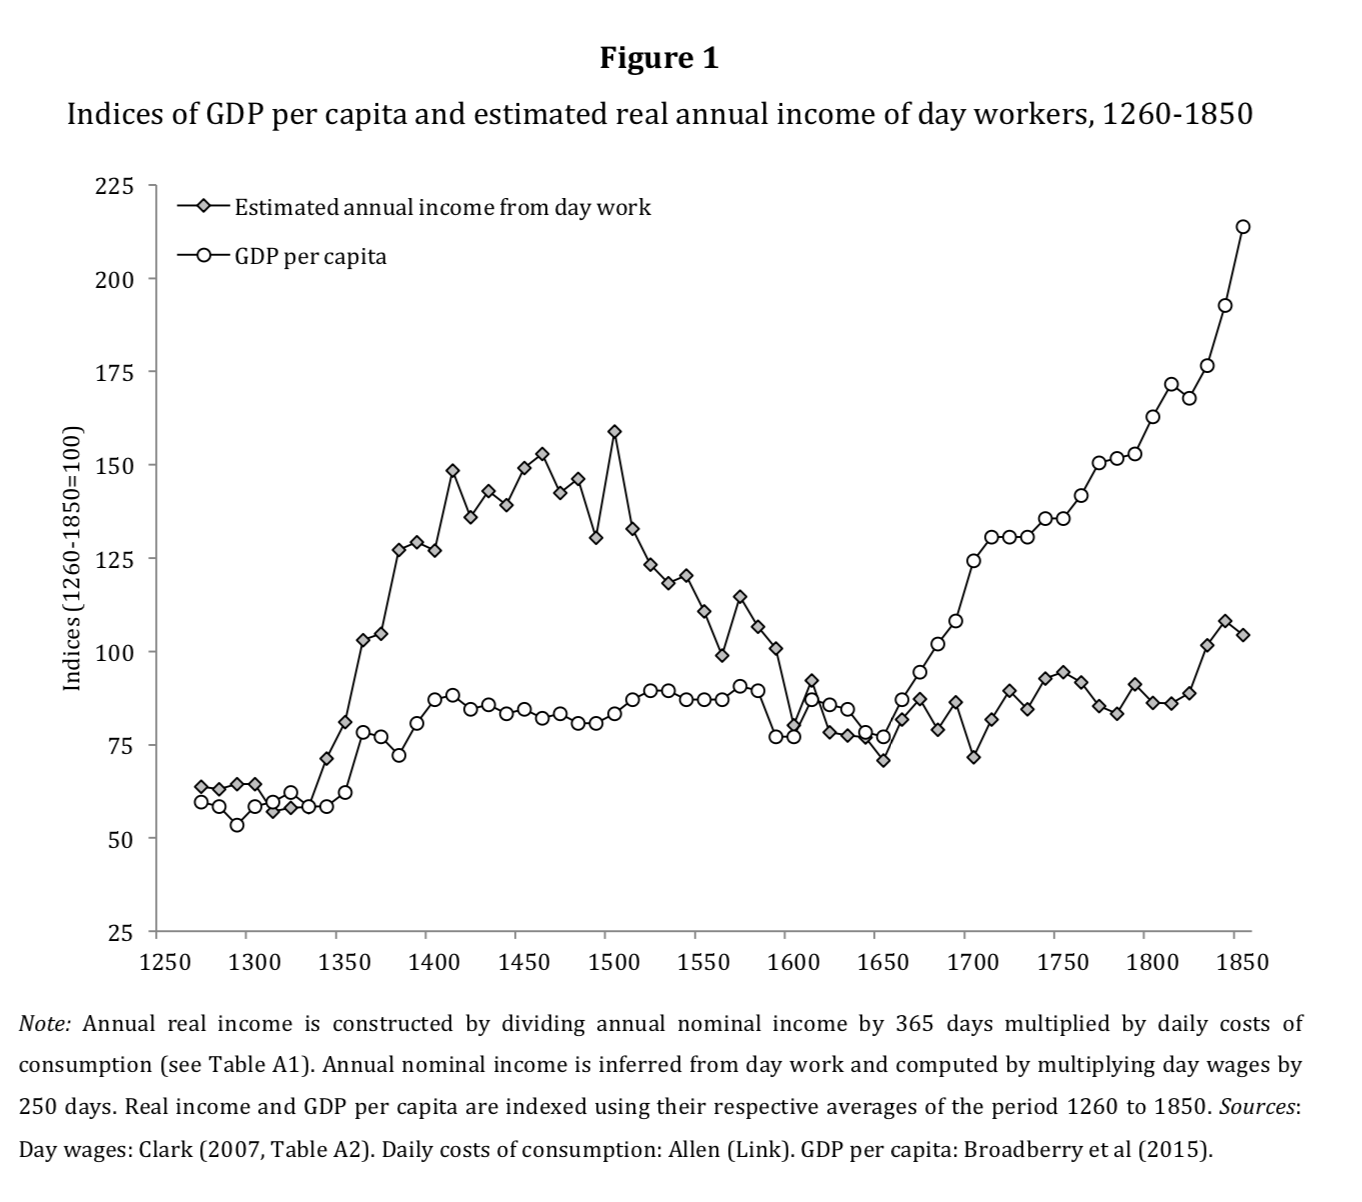
Using aggregated data, Broadberry, Campbell, Klein, Overton, and van Leeuwen in British Economic Growth, 1270-1870 come up with a series for GDP per capita, plotted in the open circles in the figure. This shows a take-off to growth around 1650. However, the standard data used to establish the path of living standards has been wage data, and here a paper by Clark from 2007 is their source. As you can see, the wage data indicate no take-off in the 1600’s, and even by 1850 there is little to indicate that wages are experiencing sustained growth.
These two data series tell very different stories about the origin of economic growth. And it seems as if one of them must be wrong. What Humphries and Weisdorf (HW) suggest, in short, is that the wage data are incorrect. The underlying issue is that the most of the discussion about living standards for workers over this period is based on observations of day wages drawn from various sources, which are then multiplied through by some estimate of the number of working days in a year - typically 250 - to get an implied annual income. But this of course has all sorts of issues. How many days of work was truly typical, and did it vary significantly over time? Even if the day wages recorded in the data are accurate, should we believe that any worker could earn that wage for as many days as they wish during a year?
What HW do is dig back into the data and pull out evidence on actual annual labor contracts. Many farm workers had annual, or permanent contracts, and the farm owner padded out that work force with day laborers as necessary. But annual contracts existed outside of agriculture as well. These annual contracts are, in theory, a much better way of measuring labor’s living standard. However, they have the issue that these contracts often included not just a monetary payment, but payments in-kind, in terms of housing and food allowances. The big issue that HW have is trying to value those in-kind payments.
To do this, they make the assumption that all annual workers received in-kind payments that had a monetary value equal to a “respectability” basket of goods. This set of goods (and services in the form of rent) was defined by Bob Allen, and you can find the details of it in the HW paper. It consists of a a certain amount of specific foods (e.g. 234 kg of bread), as well as things like soap, linen, lamp oil, fuel, and rent. The monetary value of this basket is added to the actual observed money wages in the annual contracts, and that forms the annual earnings of a worker for HW.
This is probably the element of the paper you should be most concerned with. HW check the value of this respectability basket of goods against the few contracts they have that are more specific about the in-kind benefits that a worker receives, and for those cases Allen’s basket doesn’t look too far off. But that’s not the same as saying that all workers received exactly this same kind of basket, and more important for HW, that’s not the same thing as saying that all workers received this basket over time. If the in-kind payments were declining over time, then they are overstating the growth in the value of annual earnings. If the in-kind payments were increasing, then they are understating the growth in annual earnings. I don’t know enough about the historical sources to make an educated criticism here; I’ll leave that to the economic historians. What HW do given the lack of data is reasonable, but that doesn’t make it accurate.
For the purposes of this post, let’s assume that this issue is not significant issue, and see what their numbers tell us. The punch line of the paper is really the following figure. The dark line is the annual wage series developed by HW, and the other two lines are identical to the first figure. You can see that the annual wages track the GDP per capita data very well. And as HW point out, there are two significant things to draw from that.
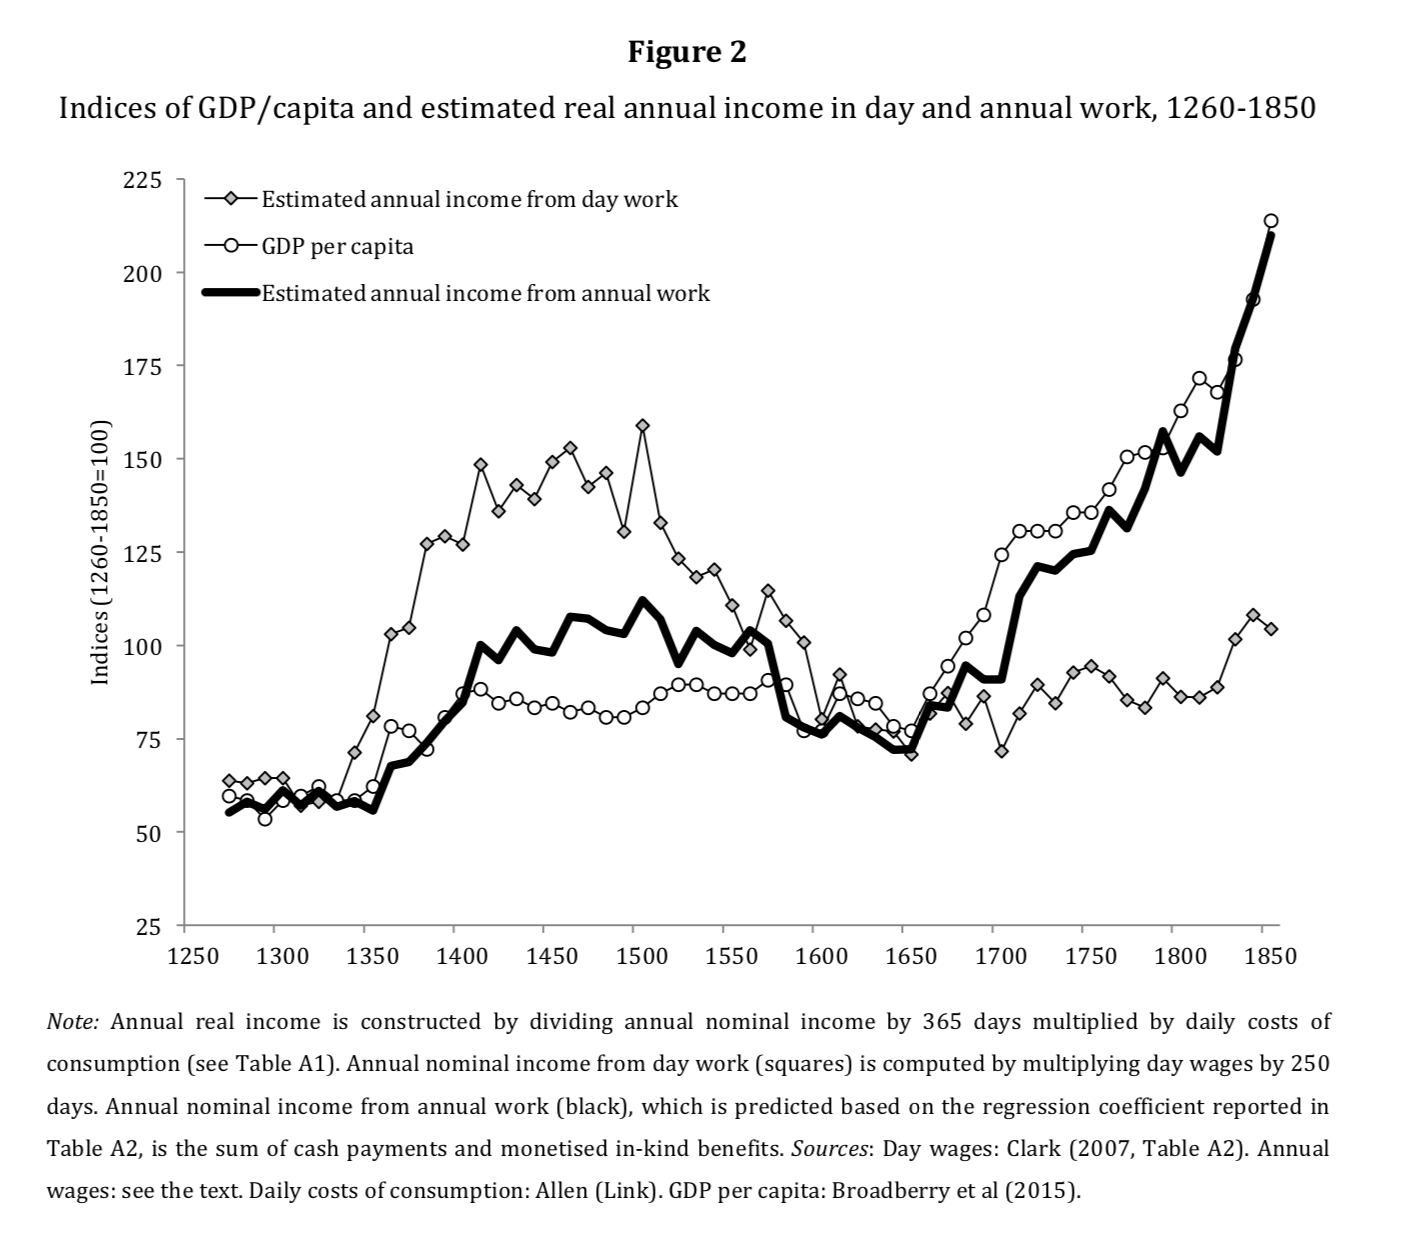
First, the reaction of wages to the Black Death (around 1350-1450) is much smaller in terms of annual wages compared to day wages. We (and by we, I mean me in most of my classes) have used the day wage data for years to illustrate the Malthusian reaction of living standards to population shocks. As the Black Death killed off between one-quarter and one-third of the population, wages shot up, but as the population recovered after that (in the 1500s) wages dropped back to their roughly stagnant level. The HW annual earnings data show that the reaction was more muted. It still existed (look at 1350 to 1400 in particular), but was not as dramatic. In fact, it does not look like annual wages ever fell back to the pre-Black Death level. This doesn’t mean that the Malthusian model is wrong; there are a lot of other changes going on in the economy over the 200 years following the Black Death. But it isn’t the neat illustration of the mechanism it once was. A different way of looking at this is as follows; assuming that the Malthusian model is correct, then the annual earnings data tell us that there must have been some kind of significant change in the English economy in that period, otherwise the earnings should have dropped back to the 50-75 range in the figure by 1650.
Second, and probably most noticeable, is the onset of sustained growth in annual earnings much earlier than the actual Industrial Revolution. Both the GDP per capita and the annual earnings series being to accelerate around 1650. The Broadberry et al series of GDP per capita does not just reflect an increase in land rents or payments to capital, but appears to also represent an increase in the real living standards of workers.
That increase predates even the most aggressive dating of the industrial revolution in terms of specific technologies (e.g. Newcomen’s engine in 1712), and is well before dates in the 1760’s based on the spinning jenny or water frame. Steam power was invented in the 1700’s, but it wasn’t really until the early 1800’s that it became a significant source of motive energy for industry in England.
What HW’s data does, in its strongest interpretation, is firmly sever the connection of the Industrial Revolution - a technological event - from the onset of sustained growth - an economic event. I’ve made this case before, and the HW findings only reinforce it. The day wage data had already sawed through most of that connection, because day wages had lagged technological change by so many decades. But notice that the HW data suggest the disconnect is not that earnings lagged the technological change, it is that they predated the technological change. This is consistent with the GDP per capita data, and that has a very different set of implications for growth.
One story that would need a rethink is human capital as the origin of sustained growth. The idea here has been that it was not until the industrial processes of England, in the mid 1800’s, started to require more human capital that the quantity/quality trade-off for families tilted towards quality, allowing for sustained growth. But if sustained growth began in 1650, then it cannot be that the change in industrial demands for human capital of the mid-1800’s led to sustained growth. Now, you could rescue this by saying that whatever was going on in 1650 was human-capital intense, and that while the timing of the story was wrong, the theory itself if right. But now we’ve got to establish what was going on with the nature of human capital in 1650 to cause this. At the same time, you need to account for the fact that population growth in England did not slow down starting in 1650, and on the basis of much data, accelerated not long afterwards.
A second story that needs some rethinking is the institutions hypothesis. Here’s what you don’t want to do. Don’t look at the HW data and decide that it must have been the murder of Charles I in 1649, or the ascendancy of Oliver Cromwell that “caused” the acceleration to sustained growth. One, the HW data in the figure look precise, but you need to imagine some kind of errors bars around their earnings series, so the take-off to growth is probably safely situated somewhere between 1600 and 1700. Two, that’s not how causal inference works. That said, I probably need to update my prior on the plausibility of the institutional changes associated with the Glorious Revolution of 1689 having an important effect on growth.
Another story that comes to mind with respect to origins of sustained growth is the role of discoveries or early colonization. By pushing back sustained growth into the 1600’s, the timing fits as a reaction to the growing colonization of the Americas. The Pilgrims were in 1620, and Massachusetts Bay Colony was organized around 1630. So one could take more seriously that the Americas were an important feature of sustained growth. At the same time, it seems hard to believe that the scale of migration and trade between the Americas and England was so big that it could show up in an appreciable change in English wages even by the late 1600’s. But like the institutional hypothesis, let’s say that I would update my prior on the importance of the colonies. I’m still not sold, but I’m a little less skeptical than I was a few days ago.
A last story that seems to benefit from this kind of data is Bob Allen’s theory about wage pressures and industrial technology. In thinking about why England adopted certain technologies in the late 1700’s and early 1800’s, and many continental countries did not, Allen cites the relatively high wages in England (compared to relatively low energy prices). The annual earnings data are consistent with his hypothesis, conditional on those technologies (e.g. the jennies and water frames and steam engines) having been invented when they were. There is still a different story to tell about why those inventions were made in the first place, but that probably will stray off too far into the weeds for this post.
In short, the HW data shakes up the stylized facts about the take-off to sustained growth enough that it should change our ideas of what caused it. It at least got me to start thinking hard about this again. We should separate the notion of sustained growth (i.e growth in annual earnings) from the notion of industrial revolution (i.e. the invention or adoption of specific technologies). Yes, we think growth depends on technological changes, but no, it does not mean it had to be the technologies involved in cotton production that led to sustained growth.
The really big question, though, is whether I can get out the next post in under six months. Stay tuned. But not too closely, because you might waste a few months waiting.