It has been a looooong time since I posted anything, and I can assign blame to all sorts of things for this. Rather than get into those, I thought I’d come back to blogging by returning to the Kaldor facts. These are all observations about the stability of various macroeconomic aggregates that Kaldor used to motivate his own work on growth, and which were subsequently adopted by essentially everyone else who studied growth as well.
The original Kaldor facts are so embedded into macro and growth that they don’t actually get talked about much anymore. Chad Jones and Paul Romer provided an update to the facts. But that update was really to argue that facts about ideas, institutions, population, and human capital were all more interesting than the original Kaldor facts about physical capital. Not because Kaldor was wrong, but because they had been accepted so completely into the canon of economics.
I guess I’m not ready to leave aside the original Kaldor facts alone. That is partly because Kaldor’s facts were originally some vague impressions based on very limited data from the US and UK; see footnotes 1,2, and 4 in this paper. This led me in a prior post to ask whether the Kaldor facts were really as robust as we thought. I went back to these facts again this fall as part of my grad macro course, which involved updating the data I used in the prior post and looking across a wider set of countries. This led me to revise my view to be much friendlier towards the facts than before. This post is thus an exercise in arguing for taking the Kaldor facts seriously.
That doesn’t mean Kaldor’s original facts (Jones and Romer cite six) can’t be tinkered with. Some of them are redundant and others are useful only under some particular assumptions. What I present here is a set of revised Kaldor facts: (1) Stable growth in output per capita, (2) stable capital/output ratios, (3) stable rates of gross capital formation, and (4) a stable cost share for labor.
Stable growth in output per capita
Let’s start with what I see as the most basic Kaldor fact, and one that still seems remarkable when you think about it. The growth rate of output per capita (or labor productivity if you care to call it that) is very stable over long periods of time for most developed countries. I’m going to throw some data in on developing countries to see how they compare, but this whole post is really concentrating on developed country facts.
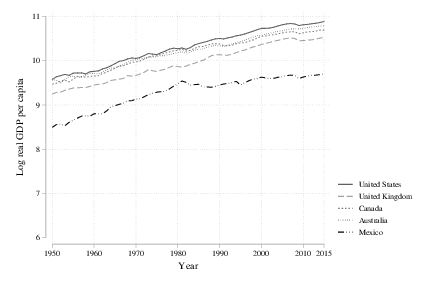
The first figure plots the log output per capita over time for a handful of countries. This handful was chosen very deliberately, as they all show remarkable stability in the growth rate of log output per capita over time. I’m going to tag this the “balanced” group of countries, given the stability of the growth rates. Yes, Mexico shows a break around 1980, but on both sides of that break the growth rate is stable. A last comment on this group is that not is the growth rate stable within each country, but the growth rates are similar across countries. There appears to be a common growth rate for output per capita over time for developed countries.
A quick mathematical aside. You can see that stability from the fact that the lines stay roughly straight. On a log scale, the slope of a line is the growth rate, so the fact that the slope stays the same for all these countries over time means that their growth rate is stable over time.
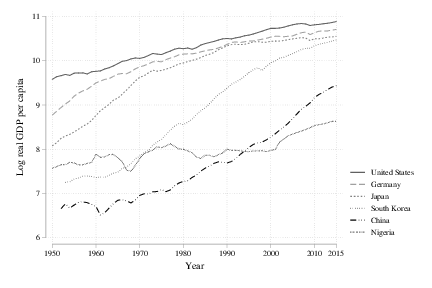
The second figure plots the log output per capita over time for a second set of countries, which I’ll call the “catchup” group (with the US as a reference). Here the pattern does not look like stable growth. You can see some experiences with rapid growth (e.g. high slopes) for Germany and Japan between 1950 and 1980, and for South Korea and China after 1970 or 1980, respectively. The growth rate for Nigeria is close to zero for most of the time period, with some acceleration towards the end of the figure.
This catchup group doesn’t seem to have stable growth rates. But if you look at Japan and Germany, you’ll see that they start to display that stability as they approach the US level of output per capita. South Korea appears to be headed that way as well. Whether China follows a similar trajectory to South Korea, with growth rates falling as it approaches developed levels of output per capita, remains to be seen. Whether Nigeria ever has the same takeoff as South Korea (or Japan earlier) also remains to be seen.
The point is that the Kaldor fact about stable growth rates appears to hold in the limit, but not necessarily at any given point in time. Past experience - Japan, Germany, South Korea - suggests that the growth rate tends to become stable over time if it isn’t stable to begin with. That past experience is why you’d get most economists to predict that China’s growth rate will eventually stabilize at a rate similar to the one seen in other developed countries.
Stable capital/output ratios
The second Kaldor fact is that capital/output ratios are stable. This one is going to be more tenuous than the stability of growth rates. Here’s the capital/output ratios for the “balanced” group of countries.
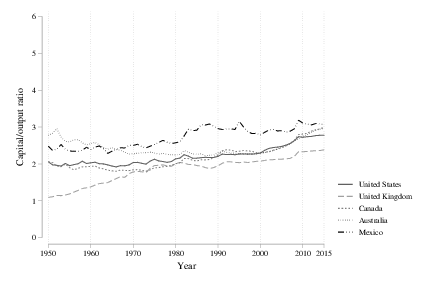
That is stable…ish. Most of these appear to have been drifting upwards over time, from around 2 in 1950 to around 2.5-3 by 2015. One reason to not get too wired up is that the drift could be a data artefact. All the capital/output ratios are calculated from the Penn World Tables, and this may have to do with how output and capital are valued cross-country. If you look only at the US, and use just US national accounts data, you can see more stability in the capital/output ratio.
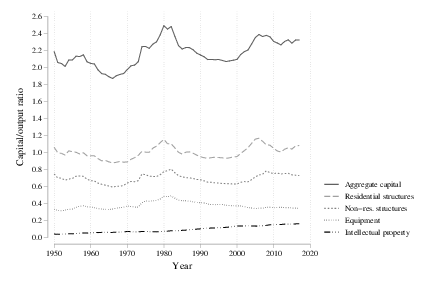
The top line here is the capital/output ratio in aggregate, and while the scaling makes it look more dynamic, note that it stays within a narrower range between 2 and 2.4, with a less obvious trend upward. Moreover, the lines below that measure the capital/output ratio for separate components of the capital stock. Residential and non-residential structures (the dominant part of the capital stock) have fluctuations but very little obvious trend. Equipment also has no distinct trend. The only component that does is intellectual property, and that trend may be due to a lack of accurate accounting in the past.
Now let’s hop back to the “catchup” group of countries. Here you could talk yourself into stability for Germany and China, perhaps. But there is clearly an upward trend for Japan and South Korea. But note that for both Japan and South Korea, the capital/output ratio does appear to stabilize in the 15-20 years. This would be consistent with the stabilization of their growth rates in the same period after they caught up to places like the US and UK in output per capita.
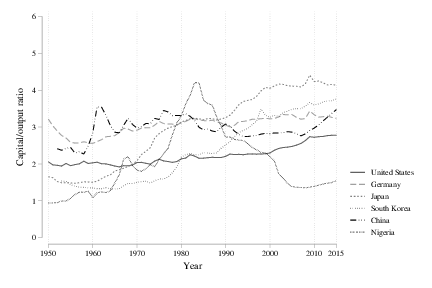
If it seems like I’m straining to make the case that the capital/output ratios are stable, I am. This is the least convincing of the Kaldor facts. The idea that capital/output ratios are stable, or are heading towards stability in places like Japan and South Korea, is informed in large part by the theory (Solow, neo-classical growth) that was built on to explain that stability. Thus there is some circular reasoning going on, and here’s where the biggest dose of skepticism about the Kaldor facts should be located. We can’t help but look at the Kaldor facts and see the Solow model at work, and infer that the capital/output ratios must stabilize eventually. But if you hang in there a few sections, I’ll throw in some other data on rates of return that corroborate the stable capital/output ratio story.
There is also a deep dark rabbit hole to stumble into here, involving the Cambridge controversy and Lant Pritchett’s critique of using the perpetual inventory method to calculate capital stocks. As this post is already going to be long enough, I am going to skip past that hole for now. Let’s just say that the stability of the capital/output ratio is a very rough approximation of what we see in the data.
Stable gross capital formation share
This one is never brought up by Kaldor explicitly, although Domar’s 1946 paper does mention it as a stylized fact. The stability of the gross capital formation share of GDP is crucial in making sense of a stable capital/output ratio. It seems worth establishing whether the data support this.
Yes, I said “gross capital formation” share as opposed to “savings” or “investment” share. I’m getting more and more convinced that using either of the latter two terms adds too much confusion. It is nearly impossible to shed the colloquial meanings of “savings” and “investment”, even for economists. The gross capital formation share of GDP is the fraction of all real output that consists of new capital goods (e.g. new buildings, computers, or bulldozers). It’s “gross” in the sense that it includes capital goods purchased to replace old depreciated capital goods.
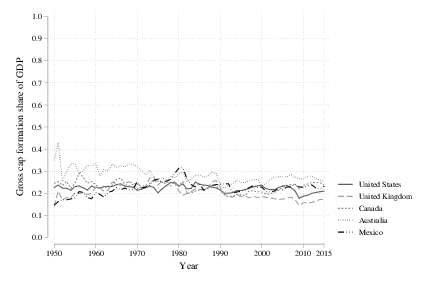
First is the share for our balanced group, and you can see the stability of that around a value of 0.2 to 0.24 for most of them. Dips and spikes occur for sure, but similar to before there is no distinct rise or fall in this share. The second figure here is for the catchup group, and we’ve again got a lot more excitement. Germany has a pretty stable rate. But Japan and South Korea have rates that are quite high for a time (0.3 or more) before they appear to revert back to a slightly lower rate. Nigeria had a distinct drop in the GCF share in the early 1980’s, but appears stable since then.
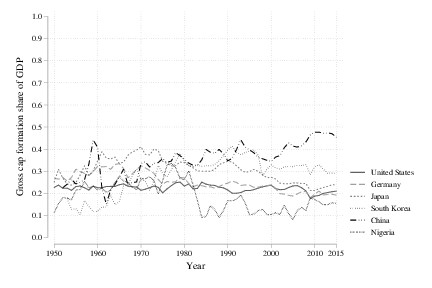
China is the obvious odd duck here, with a share for gross capital formation that does appear to trend up over time. This trend has to end at some point, as the GCF share of GDP cannot go above one. But there is nothing here that says when it will stop trending up. This catchup group shows, as before, more movement than would be expected just looking at the balanced group. But compared to the capital/output ratio, the stability of the gross capital formation share seems more solid.
Stable cost shares
Kaldor cited the stability of the output share of labor and capital in his work. I’m going to alter his fact to refer to the stability of the cost share of labor. That is, I’m interested in the payments to labor (i.e. total wages) as a fraction of total costs (i.e. total wages plus total capital costs), as opposed to the fraction of total output (i.e. total wages plus total capital costs plus economic profits). Starting with an initial critique by Robert Hall, the cost share is more relevant to building a theory of production and growth (but perhaps not of distribution) than the output share. We can use the cost share, under mild assumptions, to infer the elasticity of output with respect to labor. We could use the output share, as Solow did, but that requires much stronger assumptions than I think we should be making.
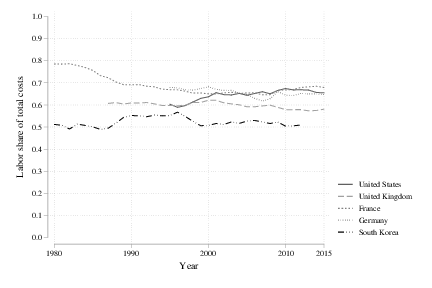
The figure plots the share of costs going to labor, using data from KLEMS. These shares are available for fewer countries and years than the Penn World Table data that is used in the prior facts. What we can see here is something that looks stable…ish. The French data, in particular, show a decided decline in the cost share from 1980 to 1990. But for the rest, the shares don’t have distinct trends. That should indicate to us that the elasticity of output with respect to labor in any production function we use is stable over time. Stable elasticities are what the Cobb-Douglas production function provides, and hence these stable cost shares give us some reassurance that this production function is a decent approximation.
Of course, I should probably mention that these cost shares are wrong. If you read through KLEMS documentation, which I made the mistake of doing over Thanksgiving break, you’ll see that this labor share probably isn’t quite right for our purposes. Worse, if you read through the last four or five papers that David Baqaee and Emmanual Farhi have written, you’ll see that the correct way to compute the elasticity involves combining information on cost shares at lower levels of aggregation and weighting them with an I/O matrix. I am working on a paper on calculating the elasticities correctly. Okay, fine. I downloaded some data and have two scribbled note pages. But I have every intention of working more on a paper calculating the elasticities correctly.
For the moment we’re going to stick with the crude cost shares in the above figure, because that’s what I’ve got. But check back with me in a few months a few years from now, and I’ll get you a better answer on cost shares.
What about rates of return?
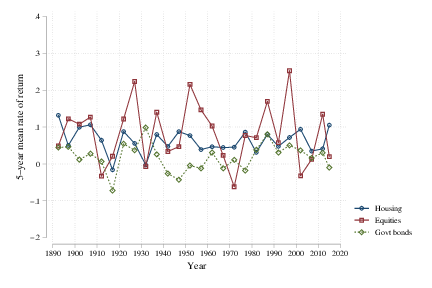
An omission from my primary list of revised Kaldor facts is the stability of the rate of return on capital. And if you look at recent data associated with a paper by Jorda, Knoll, Kuvshinov, and Taylor, you’ll find a lot of stability in the rate of return. Here’s a figure from the U.S., plotting five-year averages of the rates of return for three asset classes from 1890-2015. You get something similar for the other major developed countries in their dataset.
I don’t think this needs to be one of the core Kaldor facts. It is almost redundant with the capital/output ratio. Or perhaps a better way to say this is that the stability of the rate of return provides some assurance that there is stability in the capital/output ratio. It would not be hard to convince me, however, that you could use the stability of the rate of return as the main Kaldor fact, and then see the capital/output ratio as redundant. But I like the capital/output ratio a little more because it speaks directly to how a growth model is built (i.e. the properties of the production function).
You should be more impressed
Regardless of whether you want to include the rate of return or not, the apparent stability of these different values is remarkable. Think of the technological, political, and social changes that have taken place over the last eighty years, if not the last 150 years. The structural economic changes alone - from agriculture to manufacturing to services - have been staggering. Yet despite all of that, the growth rate of output per capita continues to chug along at almost 2% per year in most developed countries. The capital/output ratio in those same countries tends to be somewhere between 2.5 and 3, the share of GDP that gets allocated to capital formation is around 0.2, and the cost share of labor is something like 0.60-0.65. Rates of return on capital didn’t fundamentally shift up or down. These economies have a remarkable stability to them at the macro level despite all sorts of instability and changes at the micro level.
The Kaldor citation I gave you above is from 1957. Solow published his model of economic growth in 1956. These were economists talking about the inherent stability of economies that had just whipsawed through the Great Depression and World War II. The Harrod/Domar model of growth that Solow was reacting to featured inherent instability, which was seen as a feature not a bug because it accorded more readily with recent experience. Talking about stability in economic growth was, for the time, a rather radical idea. The Kaldor facts are interesting precisely because they are about stability, not in spite of that.