A second post in less than two weeks. It’s a Christmas miracle!
If you’ve read this blog for a while, you probably know that I’ve got a book coming out soon. Fully Grown should be released on January 14th, just in time to get a jump on your Christmas shopping for 2020. The subtitle of the book is “Why a stagnant economy is a sign of success”. Without rehashing the whole thing (you should pre-order it now!) one of the core arguments in the book is that improvements in material living standards, women’s rights, and contraception led to a decline in fertility rates that has now put a drag on the growth rate due to population aging.
I also spend a lot of time in the book talking about things that are not responsible for the recent growth slowdown. In particular, I work through the evidence on the decline in “business dynamism”, which refers to a set of stylized facts about the speed at which jobs and establishments enter and exit the economy. See here, here, and here for the evidence. A core fact is that the entry and exit rate of establishments has declined over time, meaning that average establishment age has increased. A second core fact is that job creation and destruction rates also declined, meaning there is less reallocation of labor between establishments.
There is no disputing those facts, but I argue in the book that this doesn’t account for much of the growth slowdown. Or at least, not much compared to demographic changes. If anything, I may be underselling the importance of demographics because the aging of the workforce could also be driving the decline in business dynamism.
That connection from demographics to business dynamism is made in a relatively new paper from Hopenhayn, Neira, and Singhania. It is new enough that I was only able to squeeze in a quick reference to it during the last stages of preparing the book. This post fleshes out the connection, explaining my understanding of their logic about how demographics link to business dynamics.
Establishing the facts
To start, we need to build up some additional facts regarding business dynamics. Yes, we know that establishment entry rates and exit rates have fallen over time. But for HNS, to understand this it is important to see how exit rates and establishment size change with the age of an establishment. Once we know these new facts, HNS are going to merge this information on establishment demographics with information on worker demographics and show how they are linked.
The data I’m using here come from the Business Dynamics Statistics at the U.S. Census, the same source that HNS use. And before we keep going, let’s be clear that I’m talking about establishment dynamics (e.g. individual Starbucks locations) as opposed to firm dynamics (e.g. Starbucks as a whole). I don’t need Decker flaming me all over Twitter for mixing the two concepts up.
The first fact is that the exit rate of establishments falls as they get older. The figure below shows this by plotting the exit rate in a given year for different ages of establishments. The multiple points (plotted using + signs) in each age category are observations from different years.

Establishments of age zero are brand new, and by definition cannot have exited yet, so their exit rate is zero for all years. But one-year old establishments have an exit rate of 20-25 percent depending on the year. Many establishments fail right away. As you move to the right you’ll see how the exit rate declines with age, to under 10 percent for establishments that make it to 20 years or older. The “Censored” category captures establishments that were already in existence in 1977, which is as far back as the statistics go, so they could be any age.
The decline in the exit rate with age is consistent with a story that “only the strong survive”. Each year, presumably the poorest performing establishments in a given cohort are the ones that exit. That means the remaining establishments are relatively profitable, which one could easily imagine is a persistent quality of those establishments.
We might also expect that more profitable establishments expand, and thus that they have more employees. And this is what we see. The next figure shows that establishments tend to be larger as they get older. I’m always a little surprised that the slope of this relationship isn’t higher. Establishments that are one year old have roughly 10 workers, on average. But establishments that are 26 years old or more have only about 22 workers, on average. Some of this is due to looking at establishments rather than firms. Starbucks got much bigger as a firm as it aged by adding establishments, but each individual Starbucks didn’t necessarily get bigger.
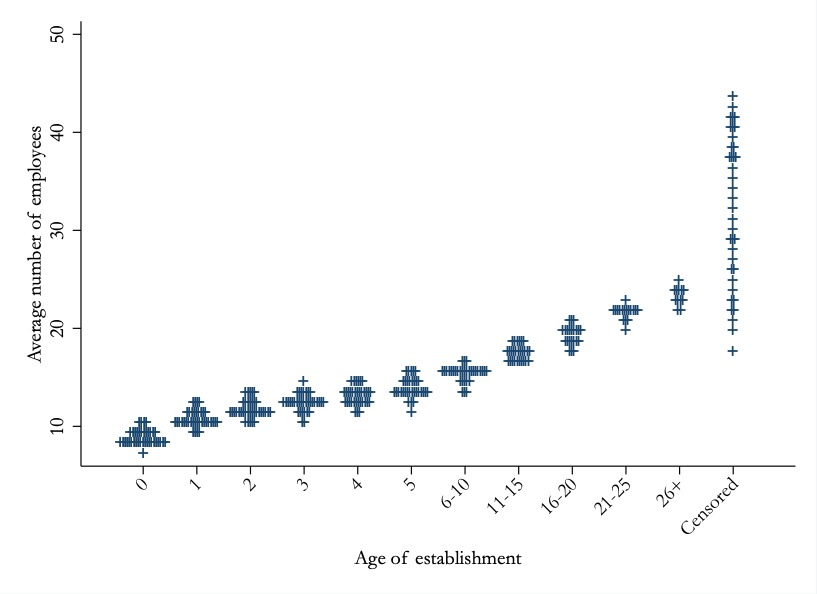
Regardless, there is an increase in average size as establishments get older, consistent with the “strong survive” story of establishment growth. This relationship of age to size, and age to exit rates, are going to be crucial to the HNS story about demographics and business dynamics.
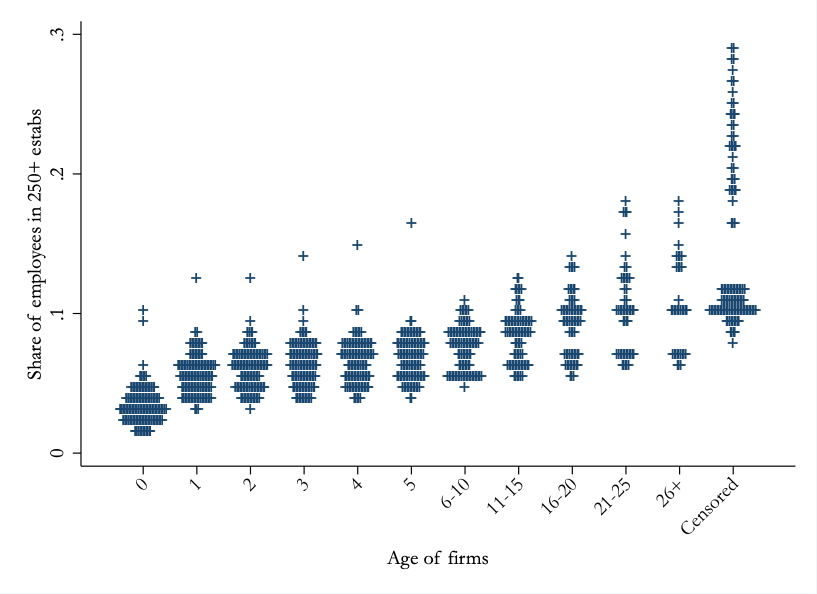
The last fact that HNS talk about is related to the size of establishments, but in focuses on the concentration of employment. This last figure shows the share of all employment in a given age category that is in establishments with more than 250 employees. This goes from well under 10% when establishments are age 1, to around 10%-ish when establishments are aged 21+ years. This isn’t a huge difference, but it again is consistent with the story that only the strongest establishments survive.
On top of the these three facts from HNS, I’m going to include one more that is related to the average age of establishments. We know that the aggregate exit rate fell over time and the average establishment size rose; those are two of the stylized facts related to the slowdown of business dynamism. You can perhaps guess at this point that this is all consistent with an increase in the average age of establishments, as shown in the following figure.
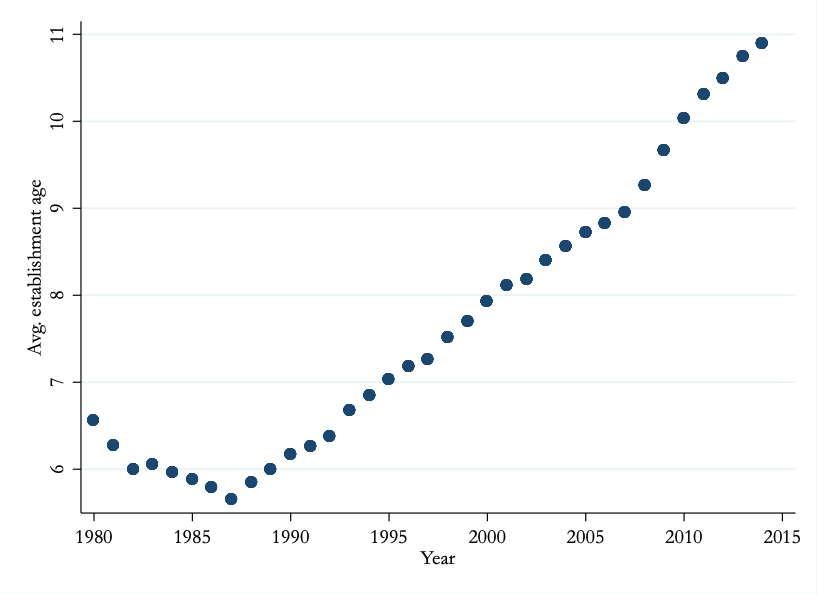
You should ignore the little dip in age in the early 1980s, as this is driven in part by my assumption about how to treat the “Censored” establishments that already existed in 1977 when the statistics begin. But from about the mid-1990s to now you can take more seriously the information in the figure. The average age of establishments increased at the same time that exit rates fell, entry rates fell, and average establishment size increased.
A simple example
We’ve got these facts about establishments in place. Why should we think that the demographics of workers had anything to do with the downward trend in exit rates and entry rates? To see how this all works, let me start with a really naive example that ignores the age structure of establishments from the prior section entirely, and then fold that back in once we’ve got some logic built up.
Start with 1,000 workers in an initial year. And in each subsequent year, the economy adds another 1,000 workers. This can be a net addition if you want (some existing workers retire, and extra workers get added), but that isn’t crucial.
While the absolute number of workers is rising over time (1000, 2000, 3000, 4000, etc.) the net growth rate of the workforce is dropping. In the first year, it is 100% (1000 to 2000), then 50% (2000 to 3000), then 33% (3000 to 4000), and so on. The net growth rate of the workforce doesn’t ever become negative, but it does decline towards zero as time goes on. Assume as well that the initial 1,000 workers are all 20 years old, and each year the age of the new cohort that enters is 20 as well. the average age of the workforce is climbing over time. It starts at 20, then goes to 20.5, then 21, then 21.5, and so on.
These demographics are really dumbed down, but they capture the crude features of the demographics of the late 20th and early 21st century we’re worried about. The workforce is increasing in absolute size, but the net growth rate is declining and the average age of workeres is rising.
Let’s now add in establishments. We’re going to assume that each establishment employs exactly 250 workers. For whatever reason, that is the only scale that works to make a establishment profitable. This “quantum” for establishment size is going to automatically reduce establishment dynamism over time, given the worker demographics.
In the first year there are 4 establishments (1000/250). In year two, there are eight establishments. Then 12, 16, 20, etc. As with the workforce, you can imagine that there is exit of some establishments each year so that the number of new establishments is higher than 4, but the net addition of establishments each year is only 4.
What about the net growth rate of establishments? That’s declining over time, just like the net growth rate of the workforce. 100%, then 50%, then 33%, then 25%, and so on and so on. We can also figure out the average age of an establishments. It starts at 1 year, then is 1.5 years, then 2 years, then 2.5 years, etc. These patterns, while not numerically accurate, capture the basic patterns seen in the literature on business dynamism; a falling net growth rate of establishments and an increase in average establishment age.
And that’s it. With average establishment size held constant, a falling net rate of growth in the workforce will generate a fall in the net growth rate of establishments and an increase in average establishment age. This just follows mechanically. The demographics can account - in my simple example - for all of the change in business dynamics.
The world is more complicated that this, and we’ll get to that. But HNS calculate that this simple logic can account for one-third of the decline in the entry rate of new establishments. Holding establishment size constant, a falling growth rate of workers will mechanically create a falling net entry rate of establishments. So we are already part of the way to explaining the decline in business dynamism using only worker demographics.
Adding establishment demographics
The prior section depended on the assumption that average establishment size didn’t change. But allowing for a realistic change in average establishment size would actually make the connection between worker demographics and establishment dynamics stronger. We know from the data that older establishments tend to be larger, and that average establishment size and average establishment age have been growing as business dynamism declined.
Let’s accommodate this in my little example. Say that every year a establishment stays open, it can absorb 50 more workers. Over the life cycle of a establishment, then, it employs 250, 300, 350, 400, and so on. In the first year, we again have 4 (brand new) establishments absorbing the 1000 workers. In year two, those four establishments can absorb 1200 workers (300x4), and the remaining 800 workers need only 3.2 firms (I wasn’t as clever with the numbers, so we’re getting fractional establishments here), for a total of 7.2 establishments, rather than 8 in the naive example. Average establishment size is now 2000/7.2 = 277, rather than 250. Most important, the net entry rate of establishments is now only 80% (3.2/4), rather than 100%. The increase in capacity of older establishments lowered the net entry rate, while also accelerating the increase in average establishment size and average establishment age. If you spin this forward you’ll see that acceleration continues over time.
But even this simple two-period example reveals a number of new issues. Note that I assumed all 4 of the original establishments survived into period 2. What if one of them failed? Then the three remaining would only absorb 900 workers, and there would be 4.4 new establishments employing 250 workers each. We’d have 7.4 establishments with an average size of 270.3 and an average age of 1.41. The gross entry rate would be 4.4/4 = 110%, and the gross exit rate would 1/4 = 25%, for a net entry rate of 86%.
Once we allow establishments to differ by age, the exact exit rate of establishments by age and their size by age matters to the evolution of average establishment size, average establishment age, and the net entry rate. The entire history of establishment entry and exit will matter in any given year, and the calculations quickly get very tedious. Nevertheless, the overall point holds. If as establishments age they tend to get larger and exit at a lower rate, then a decline in the growth rate of the labor force will push down the net entry rate of establishments even further than in my naive example, and push up the average age and average size of establishments even more. In short, the demographics of establishments cannot be divorced from the demographics of workers.
The addition of age-specific establishment characteristics can potentially allow worker demographics to explain even more than the one-third of the decline in establishment entry rates that the naive model could.
All the bells and whistles
HNS work through this all in much greater detail, and use numbers that actually match the observed data on establishment exit rates and size by establishment age. As I mentioned above, they find that one-third of the decline in the establishment entry rate can be accounted for simply by the decline in the growth rate of workers. But, in addition, the remaining two-thirds of the decline in establishment entry rates can also be attributed to the decline in the growth rate of workers given that worker demographics influence establishment demographics (and hence establishment size and exit rates). In short, the entry rate of establishments declined over the last twenty years because fewer establishments were needed to absorb the actual increase in the workforce that occurred.
What’s very important to note here is that the entire history of the workforce demographics matters. It is not just the decline in the growth rate of the workforce over the last twenty years that led to lower entry rates. It is equally the fault of the very high growth rate of the workforce in the middle of the 20th century. During that period it took many new establishments to absorb the Baby Boomers as they entered the workforce. Hence the entry rate was high during the 20th century. But as those establishments aged, the ones that survived grew larger and less likely to go out of business. By the time we made it to the year 2000, there was a built-up stock of large, old, unlikely-to-exit establishments that was capable of absorbing most of the workers entering the workforce each year. There was little space for new establishments to enter.
HNS go on to tie this together with several other stylized facts that have gained a lot of attention recently. Establishments with high markups would probably be more likely to survive, and a counterpart of higher markups is a lower share of output being paid to labor. Older establishments, then, would have higher average markups and a lower average share of output being paid to labor. Thus when the aging of the workforce pushes up the average age of establishments, the average markup in the economy would rise and the average labor share would fall. To some extent, all of the facts about business dynamism, concentration, and market power could be related back to changes in the demographics of workers.
If you’re looking for the catch, here it is. The explanation that demographics of workers can explain all of the changes in business dynamics relies on the age-specific exit rates and sizes (and possibly markups and labor shares) of establishments. The data telling us how establishment age is related to exit and size (and markups and labor shares) are drawn from the time period in which the growth rate of workers was declining. There is nothing that says these age-specific establishment rates and sizes are a law of nature. Those rates and sizes might be unique to the last few decades given changes in anti-trust policies, regulations, trade, inequality, and so on and so on. Yes, the demographics of workers and establishments are going to be linked to some extent no matter what, but perhaps the real interesting action is in what determines the age-specific exit rates and sizes for establishments.
Leaving that objection aside, the HNS paper reinforces the argument in my book regarding the role of demographics in the growth slowdown. But perhaps more interesting than that, it provides an indirect argument for increased immigration. If you believe that the changes in business dynamics - lower entry rates, perhaps higher markups and lower labor shares - are bad for the economy, then you would want to change the demographics of this country to encourage more rapid entry of workers. To do that “natively” would require substantial changes in policy and social norms, and even if you were cool with reversing access to contraception and talking people into having more kids, you’d still need to wait about 20 years for all those new babies to hit the job market.
Or, you could effect an immediate increase in the growth rate of workers by expanding immigration rates. Allowing in more immigrants would allow more establishments to open, increasing the entry and exit rates, pulling down the average age of establishments, lowering their average size, and presumably lowering the average markup and increasing the average labor share. If you were worried about whether those immigrants would take jobs from existing workers, just remember that the economy managed to absorb all of the Baby Boomers into the workforce - while also expanding the labor force participation rate of women - during the middle of the 20th century without having a substantial effect on the employment rate of their parents.
Have a great holiday! Buy the book!