As I wait to hear if and when UH will close campus because of the coronavirus I figured it would be a more productive use of my time to type than to update websites reporting case numbers. This post has absolutely nothing to do with the virus, so if you’re looking for something to either take your mind of of it, or at least put you to sleep, then here you go. At some point I’d like to do something about the economic impact of the virus, specifically using it to think about I/O networks and such, but I haven’t figured out a good way to work through that yet.
What was on my mind instead was markups, market power, and productivity, which has been on ongoing topic here. I did a few posts here and here on accounting for the effect of markups on productivity and GDP. One of the points of those was that given an increase in average markups, there may be a counter-intuitive increase in measured productivity and GDP at the same time. If inputs are shifted from low-markup to high-markup products, this implicitly is raising the value of what we produce from the consumers perspective.
Those posts took the increase in average markups as a given, however, and didn’t consider why that increase took place. Nor did it consider the dynamic consequences of that increase in markups, which might involve firms changing their decisions about how much to invest in innovation based on those markups.
In my grad growth course recently we went through two papers by Ufuk Akcigit and Sina Ates (AA), which focus on the reason for why markups may have gone up, but also allow one to model the dynamic consequences of those markup changes. The first paper provides a simpler model to get your head around, and the second gives you all the bells and whistles.
The basic story from AA is that many of the facts regarding the decline in business dynamism observed over the last 20-30 years, including the rise in markups, can be understood as a consequence of a decline in the rate of knowledge diffusion across firms. With less diffusion of knowledge, the gap in productivity between industry leaders and followers grew, which allowed for higher markups to be charged by the leaders, which in turn explains why profits rose and wages fell as a share of GDP. They also attribute the fall in firm entry rates to the decline in knowledge diffusion, as it became harder for outsiders to jump into industries. Ultimately they tie this decline in knowledge diffusion to an increase in intellectual property rights protections. Their model tells them knowledge diffusion was more important (in quantitative terms) than things like lower corporate taxes, R&D subsidies, or entry costs.
Even if you find reasons to be skeptical of their explanation, the paper provides a way of thinking about how market power and markups interact with investments in R&D to jointly determine the aggregate growth rate. It’s an application of the kind of Schumpeterian growth models that Akcigit is known for, building on the body of work associated mainly with Aghion and Howitt.
Facts on markups and dynamism
Before we get to the model and the explanation based on knowledge diffusion, let’s recap some of the facts that AA are building their model to explain. I’m going to focus on 7 here, while AA present 10 different facts, mainly just to save space and time. I did not cut and paste in all of their figures documenting these facts, and just included a few notes on each. If you’re reading this blog, my guess is that you are familiar with most of these already, and can see AA’s first paper for the specific cites and data.
-
Market concentration rose. The share of sales accounted for by the top 4 firms across industries rose from about 38% in 1980 to 44% in 2010.
-
Average markups rose. Various sources document average markups rising from around 1980 to 2010, but be aware that there are questions about whether this rise in markups is due to measurement error.
-
The profit share of GDP rose. This is consistent with higher markups on average, and you get an increase from around 2% of GDP in 1980 to around 14% in 2010.
-
The labor share of GDP went down. Consistent with the rise in profit share, from about 68% in 1980 to 60% in 2010.
-
The productivity gap rose. This one may not be as familiar. Roughly, the most productive firms have seen their productivity rise by about 30% from 2002 to 2011, while other firms saw their productivity rise by only about 10% in the same period.
-
The firm entry rate fell. Familiar to those of you interested in business dynamism. The entry rate was about 12% in 1980, and only about 8% in 2010.
-
The share of young firms fell. Young (less than 5 year old) firms employed about 18% of workers in 1980, but only about 8% in 2010.
Where do markups come from?
What AA want to do is provide a unified explanation for all seven of these facts (actually, all ten facts in their paper) without taking any of them as a given. Everything flows from the basics of how firms compete and set markups. Start by thinking about a single product (e.g. USB chargers, or dishwashers, or payroll processing services). For that product, imagine there are two firms who can produce it. Those two firms are in Bertrand competition with one another. They each choose the price they will charge, and then let the customers sort out how much to buy from each firm. The firms are aware they are in competition with the other, and so set prices strategically to maximize profits, knowing how the other firm will respond.
In other settings this can lead to all sorts of interesting behavior, but for AA things work out in a pretty straightforward manner because firms can have different marginal costs. If firm A has a marginal cost of 2, and firm B has a marginal cost of 3, then if firm A charges anything less than 3, firm B cannot match the price because it will incur a loss. So firm A will charge anything less than 3 and get all the customers. Firm A wants to maximize profits, so it will charge 2.999999, take all the business, and hence charge a markup of approximately 3/2 = 1.5. More generally, the markup charged by a firm selling any given product is equal to the ratio of the marginal cost of the trailing firm (e.g. 3) to the marginal cost of the leading firm (e.g. 2).
Firm A thus earns profits. As with any model involving markups, those profits depend on the total expenditures on the product they sell (so market size matters) and the markup itself. For the example in the prior paragraph, Firm A will take 33% of the total expenditures on their product as profits, and the other 67% will be used to cover costs. They charge 3 per unit, and each unit costs 2 to produce, so the remaining 1 is taken as profit.
By the way, if the two firms had identical marginal costs then AA assume they split the sales to customers, with each charging a price equal to marginal cost, and earning zero profits.
Next question. Why is one firm leading (i.e. has lower marginal costs), and why is one following (i.e. has higher marginal costs)? This comes about because of an endogenous decision of each firm to invest in R&D that lowers their marginal cost. This is where AA take us from a simple accounting exercise and move into the actual economics behind the dynamics of markups.
When a firm invests in R&D, they increase the probability that they will discover a way to lower their marginal cost. To make things more coherent AA assume these declines are almost always the same proportion (e.g. each discovery lowers marginal cost by 25%). But, and this will be important for their ultimate story, there is also a chance that you get very lucky and your marginal cost drops all the way to the marginal cost of the leading firm. This isn’t an analogy they use, but I think of their R&D process as one of hiring engineers. You hire engineers from the labor force at random, and any engineer has a chance of figuring out a piecemeal way of lowering your costs. But sometimes you happen to hire an engineer who used to work at the leading firm, and she is able to spill the beans on some major cost savings. This lucky break is what AA mean by “knowledge diffusion”.
This probabilistic nature of R&D explains why even the following firm - which recall makes zero sales in the model - is willing to take losses and hang in there to invest in R&D. They might be able to make enough piecemeal improvements, or get lucky enough in hiring the right engineer, to match or beat the leading firm in terms of marginal cost. If they do they become the leading firm and earn all the profits.
You can use a similar logic to think about why a outsider third firm (C) might be started by an entrepreneur who pushes the follower aside and starts competing with the leading firm. You could imagine that this is an engineer from firm B who is fed up with management and figures they can do a better job at lowering costs if they run their own firm. Again, this is what AA refer to as knowledge diffusion.
As an aside, I’m reading a book right now on the early history of Silicon Valley, and I can’t help but frame it in terms of this model. The Fairchild Semiconductor guys are the fed-up engineers who separate from Shockley Semiconductors because they thought they had better ideas about how to lower production costs on silicon transistors (and because it sounds as if William Shockley was kind of a jackass to work for). And while the Fairchild guys weren’t necessarily pursuing a dominant leader in silicon transistors, they were pursuing the leaders in the existing vacuum tube industry. End of aside.
What drives R&D investment?
Markups evolve in the AA model endogenously based on how much each firm - leader, follower, outsider - invests in R&D. And the amount they invest depends on the gap in marginal cost between leader and follower, meaning the R&D investment depends on the size of the markup. Everything is jointly determined, and leads to the conclusion that the wider the gaps (the higher the markups) the lower the R&D effort by both leaders and followers (and outsiders). This isn’t a new result from AA, it is a pretty standard one from the Schumpeterian literature on growth.
Remember that those following firms are not selling any products, just spending on R&D. If they get very far behind and the chance of getting lucky with hiring the right engineer (knowledge diffusion) is low enough, then they are looking at years of burning through funds before they might be able to pass the current leader. Thus they spend very little on R&D. Why bother?
A similar logic holds for leading firms. If they are very far ahead then they are just burning R&D money for no significant gain in profits. Imagine each time they innovate, their marginal cost falls by half. At first, they are earning 33% of expenditures as profits (3 minus 2 divided by 3). If they innovate, that’s 66% (3 minus 1 divided by 3). If they keep on innovating its 83%, then 92%, then 96%, then 98%, and so on until they are taking almost 100% of expenditures as profits. At that point, why bother to innovate again?
So when the gap in marginal cost is already very big (and thus the markup is very big) both firms have little incentive to innovate. Note that for the follower, this depends on a big gap and a low chance of making the lucky hire/discovery and catching up instantly. If the gap is big but there is still a good chance of making the lucky hire/discovery (knowledge diffusion), then the follower might still invest a lot in R&D.
What about firms that are “neck-and-neck” in the parlance of these models, meaning the gap in marginal cost is zero or very small? In that case both the leader and follower have a lot of incentives to invest in R&D. The leader because it wants to retain its lead (and profits), the follower because just one or two innovations and they can become the leader (and take those profits). In this case we’ve got a small markup and a lot of innovation.
Note that the outsider firms follow a similar logic to the followers, except they don’t care much about the gap. For them, all that matters is the chance of making the one big hire/innovation that catches them up to the leader. The higher is that chance, the more they invest in R&D.
Back to the facts
With all that set up, AA use this model to try and elicit the underlying source of the decline in business dynamism they documented about three sections ago. They consider lower corporate taxes (no), higher R&D subsidies (no), higher entry costs (no), and a lower chance of knowledge diffusion through that lucky hire/discovery (ding! ding! ding!). Before considering how that maps to the real world, let’s see that a drop in the rate of knowledge diffusion can explain the original facts.
With a lower chance of getting lucky, there will be fewer products in which the follower (or an outsider) has caught up to the leader, and more products with a clear leader and hence a gap in marginal costs. This will drive everything.
-
Market concentration rose. If more products have a clear leader, then more products have all sales going to one firm, which will show up as more concentration of sales.
-
Average markups rose. If more products have a clear leader, then more products have a gap in marginal cost and hence have a high markup. So the average markup across products is higher.
-
The profit share of GDP rose. If more products have a clear leader, more products have markups that translate to profits. So the share of profits is higher.
-
The labor share of GDP went down. If the profit share went up, the share of expenditures being paid as costs (i.e. wages) went down.
-
The productivity gap rose. Productivity is just the inverse of marginal cost here. With less of a chance of knowledge diffusion the incentives to do R&D go down and the gaps in marginal cost (and productivity) between leaders and followers get wider.
-
The firm entry rate fell. With a lower rate of knowledge diffusion, there is less incentive by outsiders to try and enter a product line.
-
The share of young firms fell. Same as number 6. With fewer outsiders entering, there are fewer new firms as a share of all firms.
The point of the paper is not that they can match these facts. Of course they can. They wouldn’t have put this paper out if for some reason the model was unable to match the stylized facts. The point is that they tied these facts to a feature of the firm decision process - the chance of getting lucky in R&D - that would not be obvious from just knowing the facts themselves.
If it seems like knowledge diffusion (a lower chance of getting lucky in R&D) is a bit of a kludge, it is. But their more extensive paper provides a better case for linking this to tighter IP protections, and offers some evidence in support of that. Think of my example of getting lucky enough to hire away an engineer from the leading firm. In the absence of tight IP rules, that engineer can basically recreate the production process of the leader at the follower’s firm. But now imagine that IP rules get tightened up.
That new engineer may know the production processes of the leader, but the follower cannot implement them because of infringement on a patent, and has to license the process. Of you can’t even hire the new engineer because they have a non-compete agreement in that product line. Either way, the incentives to invest in finding that engineer disappear.
Another aside about Silicon Valley. The Fairchild story is something that is hard to fathom in the current IP environment. When the Fairchild guys wanted to leave Shockley, they left and started a direct competitor using a technique they had developed at Shockley. What are the chances you could get away with that now? Don’t get me wrong, there were plenty of IP issues in that era, and lots of stories about having to engineer new technology to get around patents by RCA or Western Electric. But the patent defenses seem less well developed, at least to this not-a-patent-attorney. End of this aside.
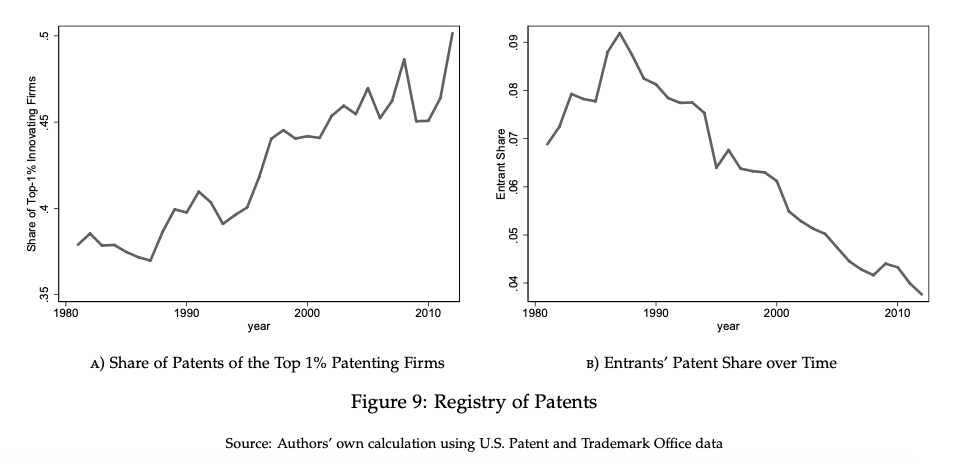
Back to AA’s evidence. They cannot document the actual rate of knowledge diffusion, but they can look at some other indicators of the flow of knowledge using patent data. Their first figure shows on the left the share of patents going to the top 1% of patenting firms, and you can see that this rose from about 37% to about 50% in the same time frame that markups rose. In the right panel you see the share of patents going to new entrants, and the decline in obvious. AA argue that this shows a concentration of knowledge in leading firms. I think what they want to argue is that the concentrating of patents at leading firms shows that they are more actively protecting IP than in the past to prevent knowledge diffusion. The increase in patent share by top firms (and the decline by entrants) is not evidence of more innovation by top firms, but rather more active IP protection of existing innovation.
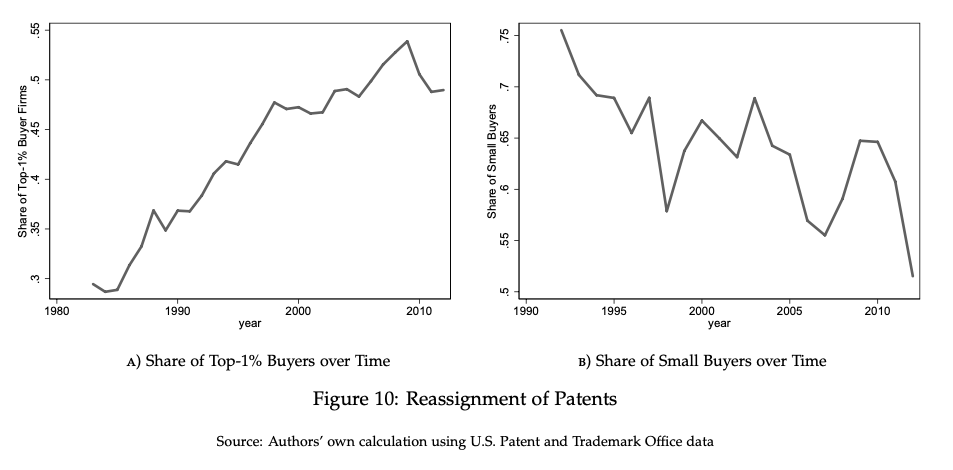
Their second set of data is on patent reassignments, which occur when one firm buys a patent from another. This is a method for a leader of creating a “patent thicket” that prevents followers or outsiders from matching their techniques and marginal costs. You can see in their figure on the left that the share of patents being purchased by firms that are already in the top 1% of patent holders increased over time, while the share of patents purchased by small firms declined. Again, AA would argue this shows that leaders are more actively trying to prevent catch-up by followers or outsiders.
To the extent that you believe that these figures imply a decline in knowledge diffusion, then the qualitative story AA are telling has some backup. What their model did for them was allow them to quantitatively assess the role of knowledge diffusion, and find that it could be the dominant explanation for all of those facts they documented.
What is this missing?
The AA model and explanation is very nice, and hangs together. It is important to note that AA have chosen one way to model and think about the origin of markups. There are alternatives, and those alternatives could give you different ideas about why average markups rose. The choice AA made allows them to speak directly to the incentives for innovation. You could use a different model allowing for competition of some kind (e.g. Cournot or something more exotic) and perhaps get a different source of those seven facts. That isn’t a particular jab at AA. That is just the nature of attempting to model something.
A more tangible issue has to do with shifts in expenditure shares across products. One fact that AA don’t bring up, but which appears to be pretty robust, is that the average markup rose over time in part (large part?) because expenditures shifted away from low-markup products and towards high-markup products. That was part of the story I was telling in my prior posts about how higher average markups could be associated with higher productivity.
AA’s model can match the evidence on higher average markups, but that is coming entirely from higher markups within product lines. In their model the expenditure on each product is fixed as a fraction of total GDP, so there are no shifts across products at all. In that sense their explanation is incomplete, and without accounting for that I’d say that we should treat the knowledge diffusion explanation with some skepticism.
Speculating, you might still be able to use knowledge diffusion as an explanation if you assumed that knowledge diffused more slowly in some industries but not others. In the products where diffusion became harder you’d get widening gaps in marginal costs and higher markups, as explained above. Those products would look relatively expensive compared to everything else. If preferences were such that all products were complements to some extent, then the higher price for those products with less knowledge diffusion would result in an increase in our expenditures on those products. You could thus account for the shift in expenditure towards higher markup products, explained by the decline in knowledge diffusion in those select products. You’d still have to show that markups were higher in those same products over time.
As this post has already reached a ridiculous length, I’m going to stop here. Regardless of my complaint about the expenditure shifts and markups, the AA papers are still a useful structure in which to think about these issues. They are also give you a fairly streamlined structure to think about these leader/follower models that have been used in a wide variety of applications within the field of economic growth, and are worth reading just to see what the state of the art looks like.