The figure below is from the Hamilton Project but you could have found something similar in a lot of evaluations of the relief bill. It compares the projected path of GDP with the relief bill to the CBO projection of potential GDP formed in January 2020, prior to the pandemic.
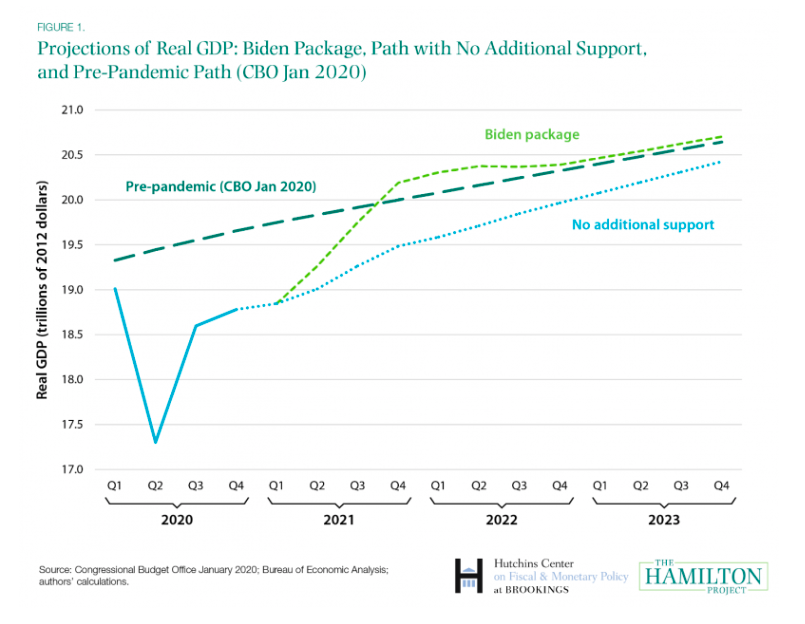
As you can see it projects that the relief bill will put us the earlier CBO projection by the end of 2021 and early in 2022. This is one argument used against the bill, or at least against the size of the bill. The idea is that the relief bill will “overheat” the economy or cause the economy to run “over potential”. Some leave that complaint as is, assuming it is self-evident that this would be bad. Others take time to explain that they think running above potential raises the risk of inflation.
The problem is that while the CBO refers to their projection as “potential GDP”, that is misleading. When most people think of “potential GDP” they think “The maximum GDP that we could produce before running into physical constraints”, or “The maximum GDP that we can produce before firms start jacking up prices rather than expanding real production”. That is the notion of “potential GDP” that lies at the heart of this particular inflation-based argument against the relief bill.
However, what the CBO projection actually means is “The GDP you might get if the economy was sorta like in 2005, but we took into account population aging”. It has nothing to do with physical limits, and nothing to do with firms being willing or able to increase output.
I’m going to walk through how the CBO projection is formed, and why my slightly snarky definition is in fact the correct one. And it might come off like I’m dumping on the CBO. I’m not. Aside from some quibbles about semantics, the numbers they produce are useful for specific purposes. The problem is that people use these numbers for the wrong purposes, mainly because they don’t understand how these projections are formed.
I’m not dismissing all arguments about inflation risks from the relief bill, I’m just working through this one argument about inflation risk, and why it is probably unfounded.
Oh, since apparently you are only allowed to have an opinion on inflation risks if you were alive during the 1970s, I’ll just say that I have sat in a car waiting in a gas line, watched the original Muppet Show when it was on broadcast TV, and at some point owned plaid bell-bottom pants.
Having established my macro credentials, let’s get started.
You have no potential
The answer, as always, is to read the f$&#ing manual. You can find the CBO methodology from 2018 here. That site includes software and data you can download to replicate their projections, although it is written for EViews. So for the four of you out there that still use EViews, it is your time to shine. There is also a supplement on estimating labor force participation here that is relevant to the process.
“Potential GDP” is a terrible description for what the CBO estimates. “Smoothed historical GDP” is more accurate. The figure below is from the methodology paper linked above. The dashed blue line is “potential GDP”, and you can see that it is a smoothed version of actual GDP. Their goal is just to remove business cycle effects.
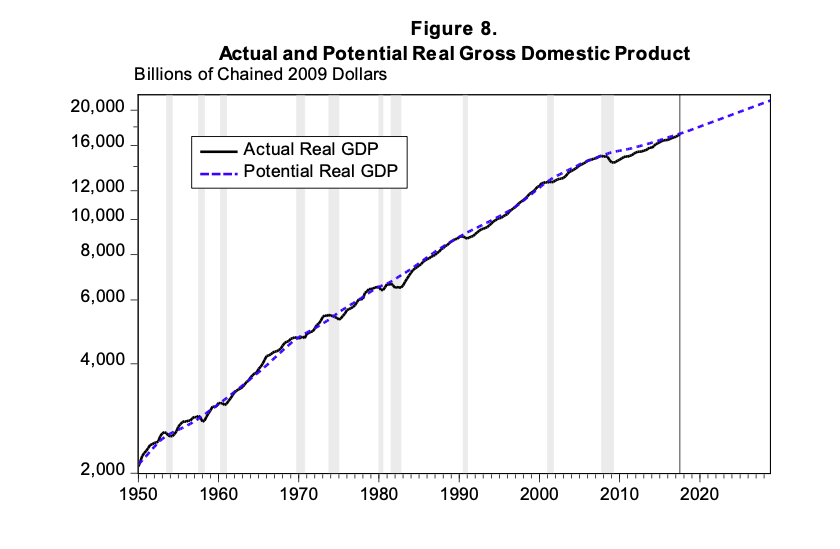
You can also see that we have to distinguish between the historical series of potential GDP (1950-2018), and the projected series of potential GDP (after 2018). The projected series, which is what went into that Hamilton Project figure that I started with, is based on information from the historical series, along with assumptions about things like productivity growth.
That projected series is what is important here, as it forms the basis of the argument that the relief bill will “overheat” the economy. So let’s break down how the CBO forms that projection.
Projected GDP for the CBO comes from a basic Cobb-Douglas production function
\[Y^{Proj} = A^{Proj} \left(K^{Proj}\right)^{\alpha} \left(E^{Proj}\right)^{1-\alpha}.\]To create an estimate of projected GDP they need an estimate of the projected size of each of these three items: TFP (A), capital (K), and employed labor (E). In each case they are extrapolations and/or flat-out guesses based on the smoothed historical series, and not based on some notion of physical capacity or limits on production.
Let’s start with TFP. “The agency therefore applies a substantial degree of judgement to its projections of potential TFP rather than simply projecting the most recent estimated trend,” (p. 35 in the 2018 report). Well, of course they do. There is no way to project TFP into the future that isn’t just a wild-ass guess. As the CBO notes in their report, TFP tends to grow at a steady rate for a while….until it doesn’t. And you don’t know when one of these jumps up or down in the growth rate of TFP is going to occur.
What the CBO does is assume that the rate of TFP growth will converge from its recent short-run trend (say about 0.7% per year) to a long-run average growth rate (say about 1.2% per year). This isn’t any worse or better than just assuming the rate will stay at 0.7%, or jump to 2%, or anything else.
But it is clear that this isn’t an estimate of how fast TFP could grow. It’s not an upper bound on the rate of TFP growth, above which the economy couldn’t possibly go.
Work it
The second, and more relevant, piece of information going into the CBO projection is employment, E. In principle, what the CBO is projecting for employment is
\[E^{Proj} = (1-u^{Proj}) \times LFPR^{Proj} \times POP^{Proj}\]where $u^{Proj}$ is the projected unemployment rate, $LFPR^{Proj}$ is the labor force participation rate, and $POP^{Proj}$ is the working-age population. In practice, this is a sum of employment projections for 516 different sub-groups distinguished by age, sex, race/ethnicity, and education. The second link above about labor force projections gives you all the info you want about how those sub-groups are formed.
Regardless, the game for the CBO projection goes like this. First, get the projected working age population, $POP^{Proj}$. That’s pretty easily done from normal demographic tables, and in that sense there is little that is controversial about it.
Next they need to come up with a projected labor-force participation rate and projected unemployment rate (for each group). Here is where the CBO’s meaning of “potential” comes into focus, and why it does not mean what you think it means.
Participation rates
The projected labor-force participation rate is found primarily by taking the average or smoothed LFPR from the past for each sub-group, while also incorporating a few actual projections by the CBO of the effects of federal policies. But the projection is not what the LFPR could be, it is what the LFPR was during “normal” economic times in the past. For example, if married females with young children had a low LFPR in the past, then the CBO projects them to have a low LFPR in the future. There is no sense of potential LFPR here, in the sense of asking what the LFPR of married females with young children could be.
The same idea holds with all the LFPR projected on the basis of race/ethnicity, disability, education attainment, birth-year, and the like. The CBO embeds all the accrued historical factors leading to variation in the LFPR across groups into their projection. It’s a sensible way to approach the projection. And it is probably a good projection of what LFPR will be in the next few years. But it is not a measure of some physical upper bound on how much the economy could produce.
Take the birth-year cohort effects they embed in their projection. This is the observation that some cohorts happen to have lower LFPR than others, presumably because of past experiences in the job market. Think of kids born around 1988-1992, who graduated from HS or college around 2009-10, had no luck finding entry level jobs, and now are more likely to be out of the labor force because of that experience. The CBO projection assumes that this cohort will always participate less in the labor force in the future. It is as if there is a fixed technological limit to their participation.
Age effects dominate the projection of LFPR by the CBO. Given historical patterns of LFPR, the aging of Baby Boomers is projected to lower the LFPR by 2.8 percentage points from 2017-2028. The historical pattern implies that LFPR starts to fall at age 50, well before standard retirement age. Does this mean that this represents a physical limit on the ability to work by people aged 50+? Is it literally impossible that more people over 50 might continue to work? If the answer is no, then the CBO projection doesn’t represent an upper bound on LFPR.
Again, the CBO is not doing anything wrong. The mistake lies is interpreting the CBO projection of LFPR as some unbreakable limit on labor-force participation (and hence GDP).
Unemployment rates
The last bit involved in the projection of employment is the unemployment rate, $u^{Proj}$. Again, the CBO is going to actually project the unemployment rate for all the different sub-groups they track, and again they are going to assume that historical unemployment rates during “normal” economic times will continue in the future.
What constitutes “normal”? Well, here is a screenshot of Appendix B of the CBO’s 2018 documentation on potential GDP calculations, and you can use the link above to go look it up yourself.
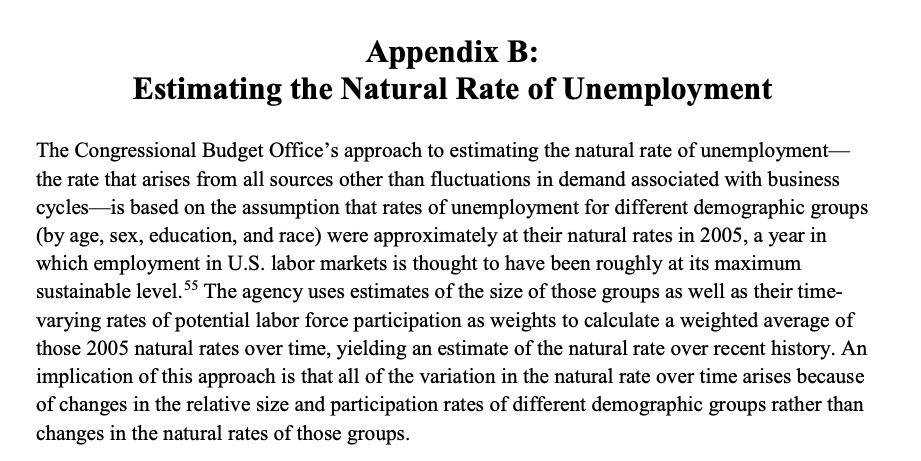
The “natural rate” for each one of the sub-groups tracked by the CBO is assumed to be whatever the unemployment rate was for that group in …. 2005? Because 2005 was the year when unemployment rates were “natural” and unaffected by a business cycle, apparently. Let that settle in for a little bit, and think about it. This has all of the same issues as the projection of LFPR.
The unemployment rate for those with less than a HS diploma, aged 25+, was 7.4% in December 2005. The CBO methodology assumes that this is the natural rate of unemployment for that group, hence they project that the unemployment rate for this group will be 7.4% in the future. As with LFPR, does this imply that 7.4% is a physical limit on how low the unemployment rate can go for those with less than a HS diploma? No, of course not.
There is no sense that the CBO projection represents a lower bound on unemployment (and hence an upper bound on employment). It’s just using a guess as to what a “normal” economy might look like. It is a mistake to use this projection as an upper bound on what the economy could do in the future.
So what is it?
What, then, is the CBO projection found in the first figure of this post telling us? At the beginning of the post I said it was: “The GDP you might get if the economy was sorta like in 2005, but we took into account population aging.” And that is the right way to look at it.
Their projection involves a guess about the future path of TFP growth. Not an unreasonable guess, but a guess. Their projection then involves a projection of labor-force participation rates based on historical experience, and population aging implies that this participation rate will continue to fall. Last, they plug in unemployment numbers from 2005 to figure out how many people will actually be working. I didn’t cover their assumptions about capital services because those get really into the weeds and from what I can tell have only a marginal impact on their projection.
Unfortunately they call this projection “potential GDP” and I think that screws a lot of people up. The words “potential GDP” connote some sort of upper bound or hypothetical limit. The CBO projections are nothing of the sort. Using “potential GDP” as a reference point to argue about the likelihood of inflation is wrong. Not wrong-technically-but-kinda-sorta-okay-anyway, just wrong.
It is quite possible for actual GDP to be above their potential GDP and yet no increase in inflation can occur. We just saw almost four years of that being the case. It also is quite possible for actual GDP to be below CBO potential GDP and yet see an increase in inflation, perhaps because Jay Powell starts doing shrooms. There is no mechanical relationship between actual GDP, CBO potential GDP, and inflation. There isn’t even a solid empirical regularity.
Here is where I am going to chuck some rocks in the CBO’s direction. Even they succumb to this notion that their projection has some real meaning regarding upper bounds. They use a form of this definition at various points throughout their documentation.
Potential output is the amount of real GDP that can be produced if labor and capital are employed at maximum sustainable rates.
What is the definition of “sustainable”? None is given by the CBO. It implies that their projection represents some sort of hard limit we must be wary of crossing lest …. some undefined entity be not sustained. Like, if the unemployment rate for people without HS diplomas drops below 7.4% will the sun explode? If TFP growth turns out to be higher than that guess, does that mean the sun explodes? Should I be worried about a Chernobyl type incident?
If you want to jump in with “sustainable means not increasing the inflation rate”, then you better be prepared to explain why 2005 is the crux of all macroeconomic history around which inflation expectations were formed. You also have to explain why people forming inflation expectations are savvy enough to account for population aging and other demographic trends, but too stupid to understand when TFP growth over- or under-shoots a guess made by the CBO. Oh, you’d also need to come up with a coherent explanation for why 1-1.5% inflation is okay, why 2-2.5% inflation is not, and why if inflation did get to 2-2.5% the Fed would suddenly lose the ability to influence said inflation rate.
I love you, CBO peeps. But you gotta clean up the language on this, because the projections are getting misused to make bad economic arguments.
Your projections are “The GDP you might get if the economy was sorta like in 2005, but we took into account population aging.” That’s a really useful set of numbers! It just isn’t a set of numbers that have much, if anything, to do with the prospects of future inflation.