In my quest to fall behind on everything in my life, I left writing up the next installment of the deep roots reviews until well after I actually gave the lecture. Here I want to go over some thinking about how geographic, environmental, and/or agricultural characteristics led to variation in development across the globe.
Where economic activity happens
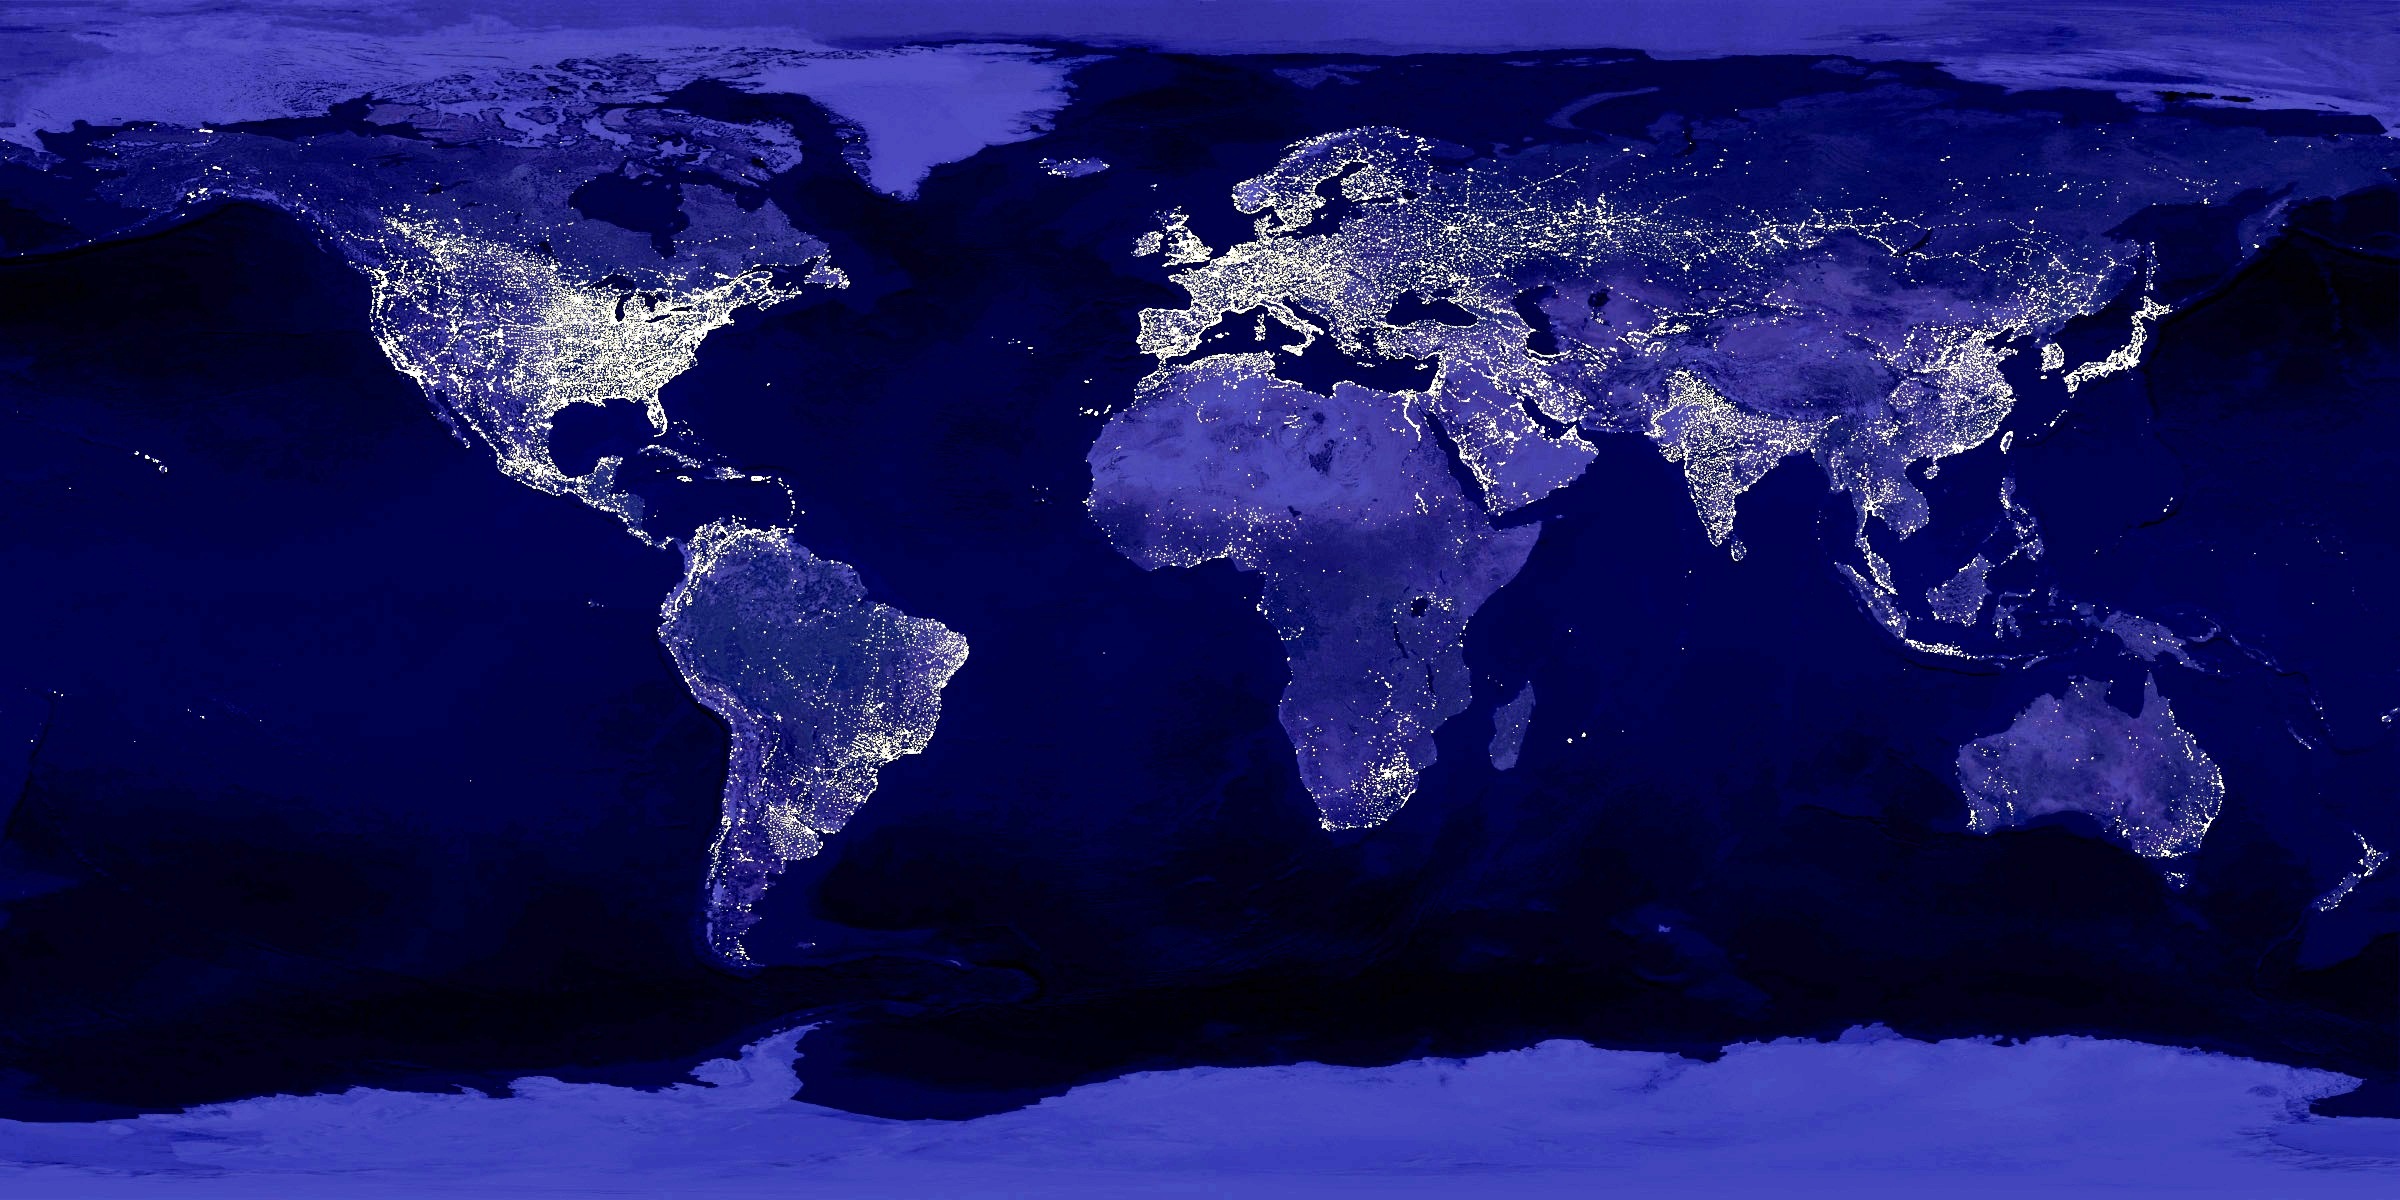
The world is not uniformly populated, and neither is economic activity distributed uniformly across the globe. The map shown above is of night lights around the globe, and they are concentrated in several areas - the eastern US, eastern Mediterranean, eastern coast of South America, Europe, India, eastern China, Japan, and a few others. If you could zoom in, you’d see that even within those areas, the lights are not uniform, but concentrated in urban areas with big stretches of relative dark in between.
One possibility is that this lack of uniformity is random, perhaps driven by contingent historical events or intitutions and culture. Michaels and Rauch, for example, find that urban areas in France are more likely to be based around old Roman towns or forts, meaning the modern location of most economic activity in France was determined in part by Julius Caesar. What Michaels and Rauch also find, though, is urban locations in Britain do not share this feature. There, because urbanization completely collapsed after the Romans left, cities and economic activity are more likely to be organized around places suitable for river transportation.
You could try to extend this kind of analysis to the entire world, and this is, in princple, what Henderson, Squires, Storeygard, and Weil did in a recent paper. They use night lights, as in the map above, to proxy for economic activity in each pixel of the map (there are 240,000 pixels). They then use a regression to explore how much explanatory power the geographic characteristics of a pixel have for those night lights. This is a stretch, but they are asking whether the world looks more like France, or more like Britain.
The geographic characteristics they use include some they relate to agricultural productivity: climate type (e.g. tropical dry forest, etc.), temperature, precipitation, number of growing days, elevation, latitude, and a measure of land suitability. Others they include relate to trade: being close to the coast, being on a river, having a natural harbor, and so on. You can quibble with the set of variables, perhaps arguing they are missing separate controls for soil types. Or you could quibble with the division into agriculture and trade, as being on a river or near a coast likely influences both. Nevertheless, their division isn’t particularly important, as all they are interested in is raw explanatory power.
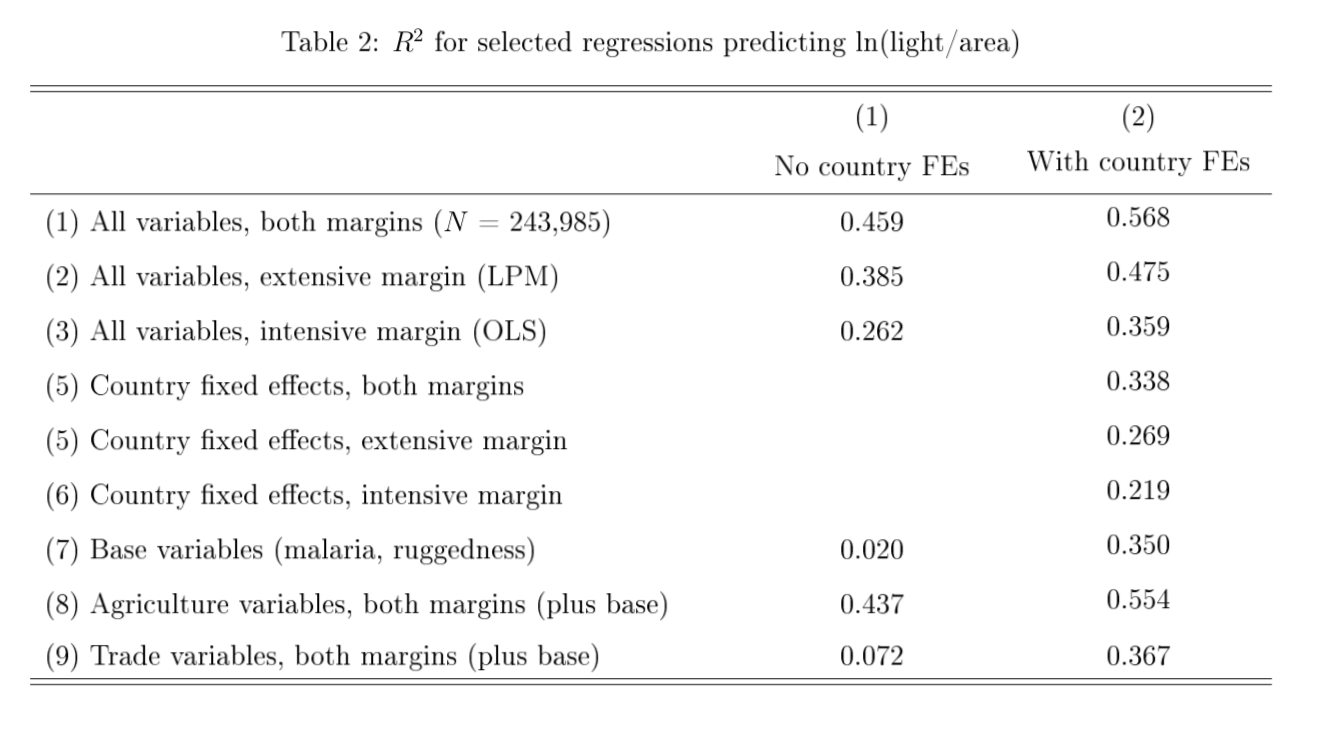
Their Table 2, shown above, gives you the summary of their results. Combined, line (1) shows you that their variables can explain 46% of the variation in night lights. In other words, raw geographic characteristics can predict almost half of the dispersion in economic activity, meaning it is a bit like Britain. But the remainder is attributable to either other geographic factors HSSW don’t measure, or to “France-like” historical factors.
If you look down the table, lines (8) and (9) show you that of their variables, the ones they associate with agriculture are responsible for almost all of the explanatory power, while trade variables explain far less. And perhaps this isn’t surprising, as we might expect that people (and hence economic activity) would tend to cluster around areas where food was relatively easy to grow.
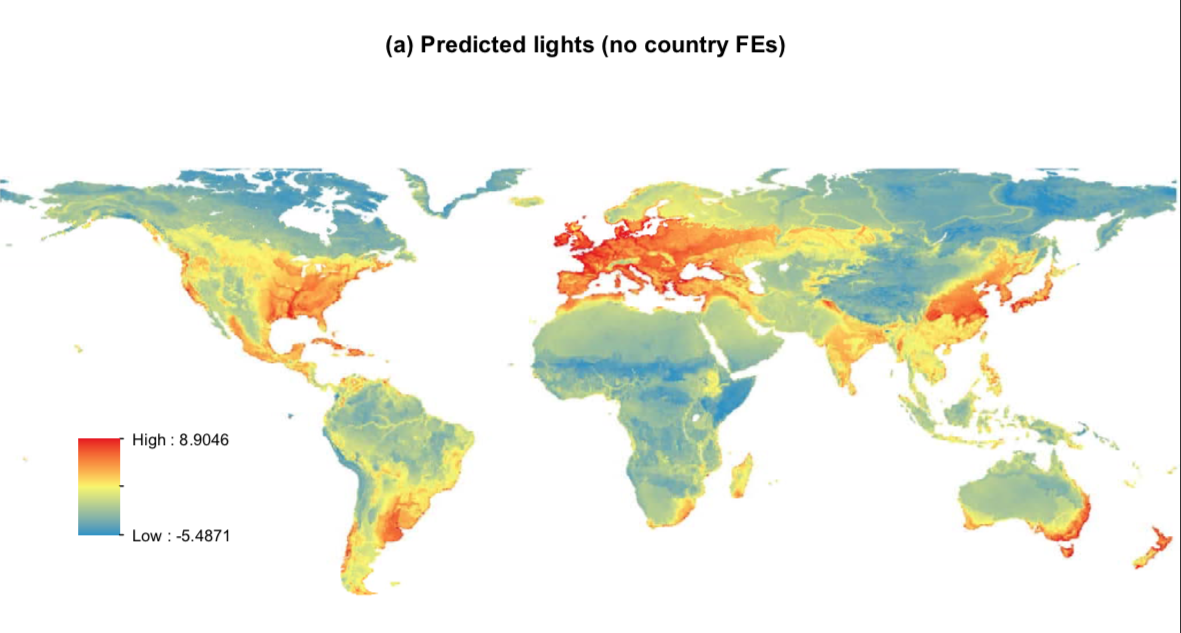
Regardless, the main story here is about these R-squareds, as opposed to causality, per se. If all you knew about the Earth was the geographic conditions, you’d be able to predict about 46% of the variation in the location of economic activity. This isn’t perfect, as the France/Britain story would suggest, and as HSSW’s own maps show. Take a look at their Figure 3, above, which plots their predicted level of economic activity by pixel from their regressions. It overstates the amount of activity in places like Cuba, the lower Mississippi and the east coast of Australia. And it misses the concentration of economic activity along the Ganges, Indonesia, or the large urban areas of Africa. It also understates to some extent the activity along the east coast of the United States.
Well, of course they can get some predictive power from geographic variables, you may be thinking. Most economic activity is clustered in a few areas (Europe, eastern US, east Asia) and since geographic characteristics tend to cluster as well (i.e. if one pixel is a jungle, the next pixel is likely to be a jungle as well), there has to be some predictive power to geography. Does this tell us something useful?
HSSW say yes, in part because of a second set of regressions they run. Because they have multiple pixels per country, they can include country fixed effects. In that case, the estimated effect of geographic variables is made only by looking at how geography correlates with economic activity within individual countries, and they are effectively throwing out cross-country variation in both geography and economic activity. In this case, they find similar patterns in the effects of geographic variables. For example, across countries places with tropical rain forests show less econoimc activity, but tropical rain forests also display less economic activity than other areas in the same country.
Hence HSSW argue that there is something important about geography, in general, in determining where economic activity takes places. It wouldn’t make sense for the same patterns to hold within and across countries unless there was something meaningful about those geographic features.
Population density
HSSW show these correlations, but do not open up the “black box” of why certain characteristics might be associated with economic activity. Other papers, however, do attempt to provide some mechanisms. One example is Ashraf and Galor, who looked specifically at the relationship of agricultural productivity to population density and living standards in the pre-industrial period. The “black box” here is a simple Malthusian model where population growth is positively related to living standards, and living standards are negatively related to the size of the population (see here for a more thorough summary).
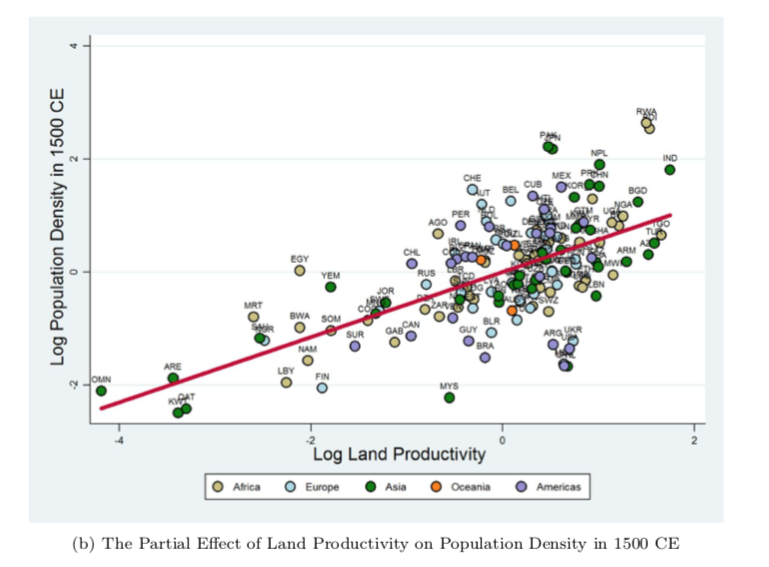
This model says that higher agricultural productivity should be associated with higher population density, but unrelated to living standards themselves. And the empirical work Ashraf and Galor do in this paper confirms these basic predictions. To measure agricultural productivity they use two things, the time elapsed since the onset of settled agriculture associated in a given area, and a combo term that mixes together some of the measures HSSW use, but can be summarized as “inherent land productivity”.
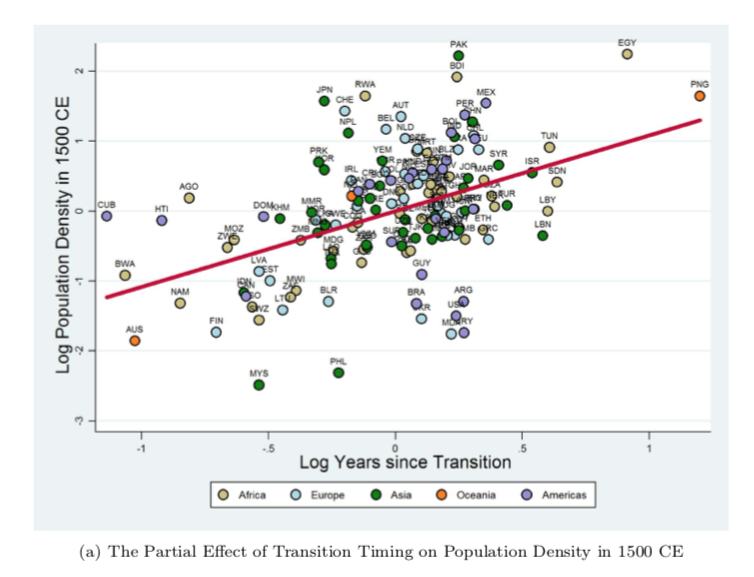
The first figure shows the partial relationship (after netting out other controls) for the years since the Neolithic Revolution and population density. As you can see, the longer this gap, the higher the density. The notional story here is either (a) that there is some learning by doing going on in agriculture, and hence the longer you have been at it, the better you are or (b) people settled the most productive places first, and this is picking up some effect of that not captured by their other variables. The second figure shows a similar plot for inherent land productivity and density. Again, the more productive, the more dense.
This is all consistent with the Malthusian black box they outline in the paper. It tells us that some of the reason for the strong geographic patterns HSSW find is that population density is higher in places with certain agricultural characteristics, and this almost mechanically is going to generate more economic activity. There is nothing Earth-shattering and counter-intuitive to these findings.
Where things get a little more interesting is in thinking about what else might be going on in that black box. If there are scale effects, or agglomeration effects, or if more people means more minds thinking about how to generate non-rival ideas, then high population density generates more economic activity over and above the simple fact that there are more people. And Ashraf and Galor have a little evidence of this as well.
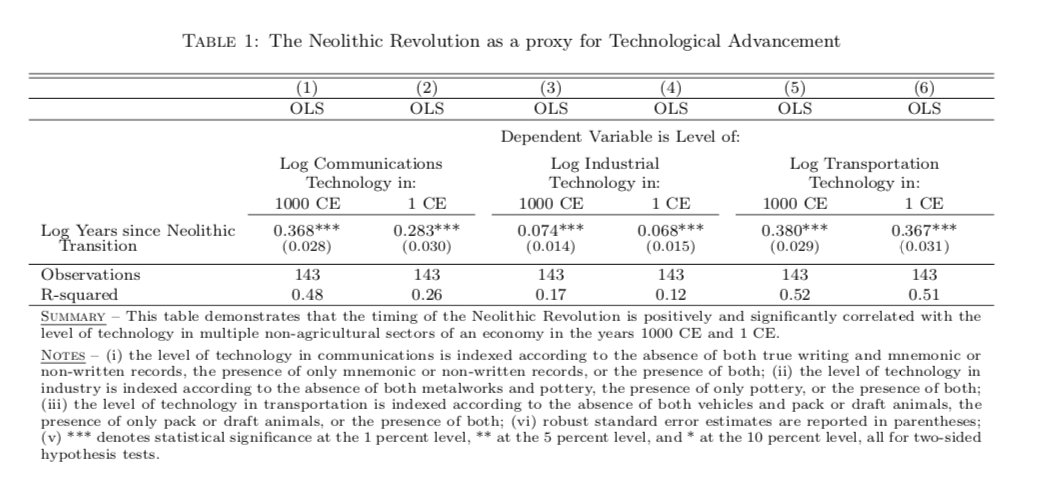
This shows the results from their Table 1, where they regress measures of technological usage (from Comin, Easterly, Wong) on the time since the Neolithic Revolution, which remember tells us that populations are more dense. In the case of all three classes of technology, the longer a country/area had been practicing agriculture, the more advanced was its technology.
There is no strict causal experiment going on here, but it is indicative that places with an early start to agriculture, which probably was due in part to high agricultural productivity, ended up with technological advantages. Comin, Easterly, and Wong already traced the persistence of these technological advantages to living standards today. I did a post on that a while ago. Thus it is plausible to argue that initial agricultural conditions are responsible for some fraction - perhaps in the neighborhood of the 46% that HSSW found - of the variation in living standards seen today.
Agricultural types and deep determinants
There are other attempts to dig into the black box connecting environmental - and in particular, agricultural - conditions and modern outcomes. These often work through the effect of particular types of agriculture on cultural norms or institutional structures. And those effects may even work to offset some of the positive advantages that high agricultural productivity may have brought through time.
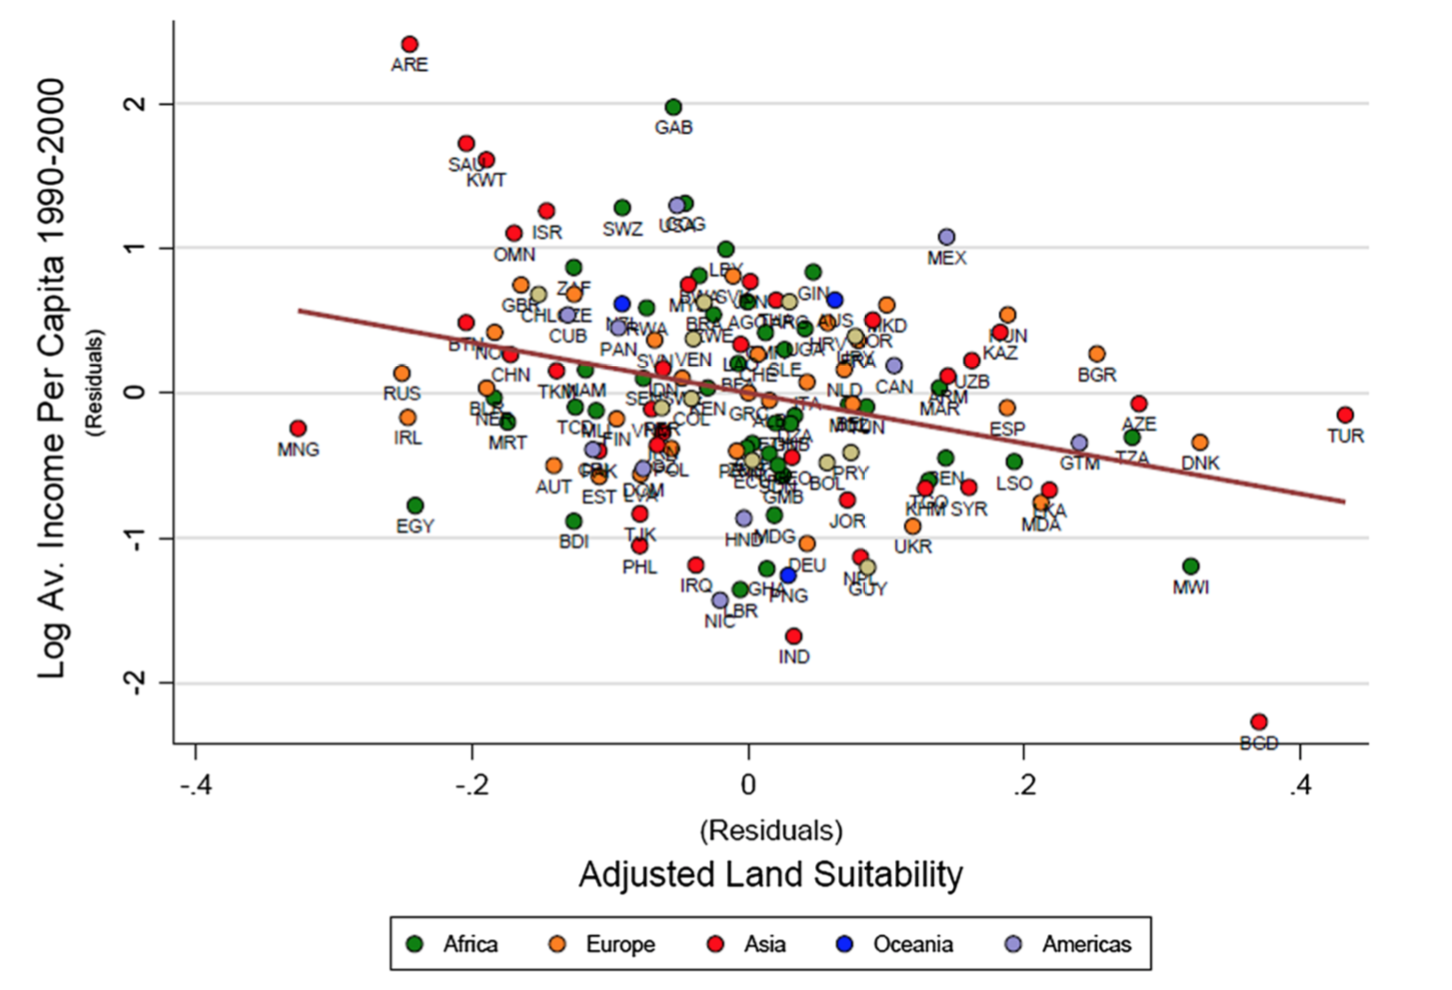
One example is from Anastasia Litina, with a paper on agricultural productivity and cooperation. What she finds is that within continents, controlling for several other geographic factors, that places with higher inherent agricultural productivity are actually poorer than places with lower productivity. The figure above shows the residual relationship she estimates.
What Litina proposes is that while agricultural suitability was a positive for population density (and probably technology) prior to the industrial revolution, once the IR hit it became a detriment. In other words, agricultural productivity may have gotten you to the industrial revolution faster, but once there it slowed you down. The reason she proposes for this is not that high agricultural productivity may led you to specialize in certain goods with low productivity growth, which you might call the Matsuyama hypothesis, but rather a cultural effect.
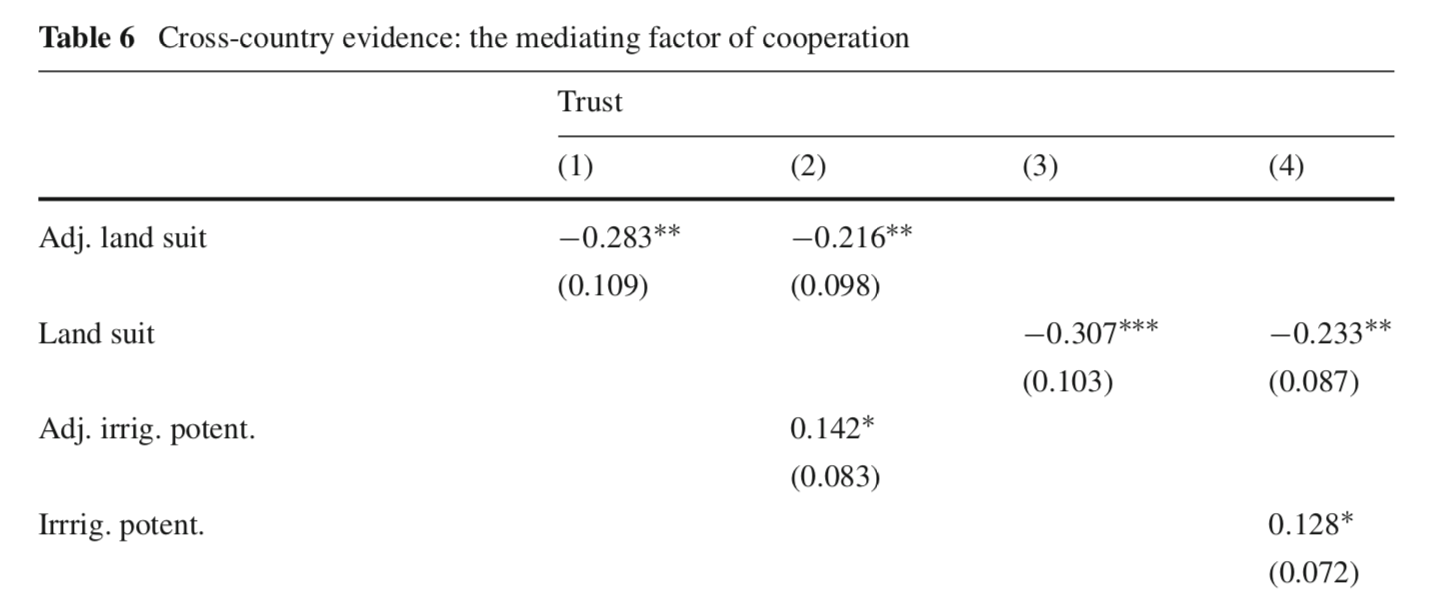
The idea is that places with low agricultural productivity are forced to cooperate more to ensure survival, and that everyone meets subsistence. This generates more within-group trust, which is then useful once you hit the industrial revolution. Places with high productivity do not have to generate that same cooperate or trust, and that hinders their industrial development. Cross-country, Litina shows that in fact measures of trust do negatively relate to land suitability.
A slightly related idea is that the specific crops you grow may require different levels of cooperation or trust. The necessity of managing large irrigation works would seem to be something that requires, and selects for, trust or cooperation. Talhelm et al looked at whether there were measurable psychological differences within China associated with whether people were from the rice-growing south, or wheat-growing north. The hypothesis was that the rice-growing region would have people that thought more holistically, and put greater weight on group outcomes.
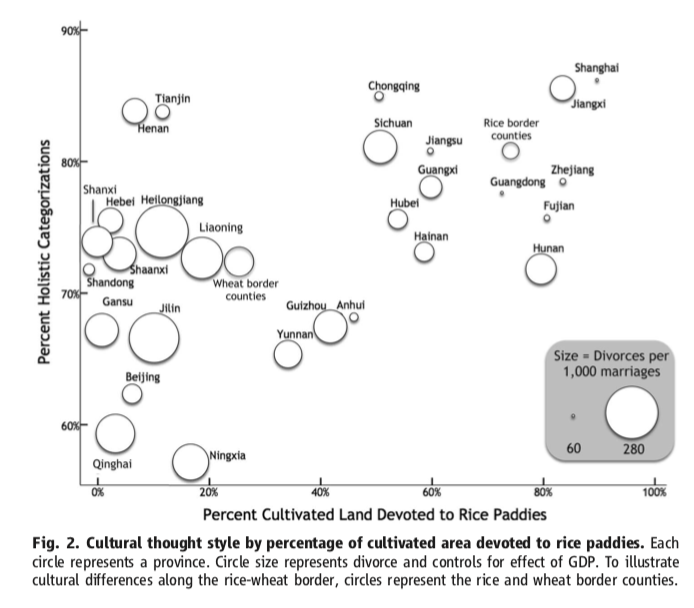
They found significant differences between the rice and wheat growing regions. The figure here shows one example of their findings, on holistic thinking. A few key pieces of information here are that they administered these tests to non-farmers within these regions. This is not research showing that farmers have different attitudes, but that even people who are non-farmers share these attitudes based on the farming that traditionally took place within their geographic area. Implicitly they are arguing for a strong form of persistence in how agricultural type influenced cultural norms over time. A second note is that the did these tests for areas on the rice/wheat border, finding similar results, and that this is not driven just be gross differences in development or institutions between north and south China. It isn’t experimental evidence, but it is suggestive.
A last example of how the particulars of agriculture might translate to cultural differences is from Alesina, Giuliano, and Nunn, who looked at how agricultural areas where the plow was used have very different attitudes towards gender roles than areas where plows were not used.
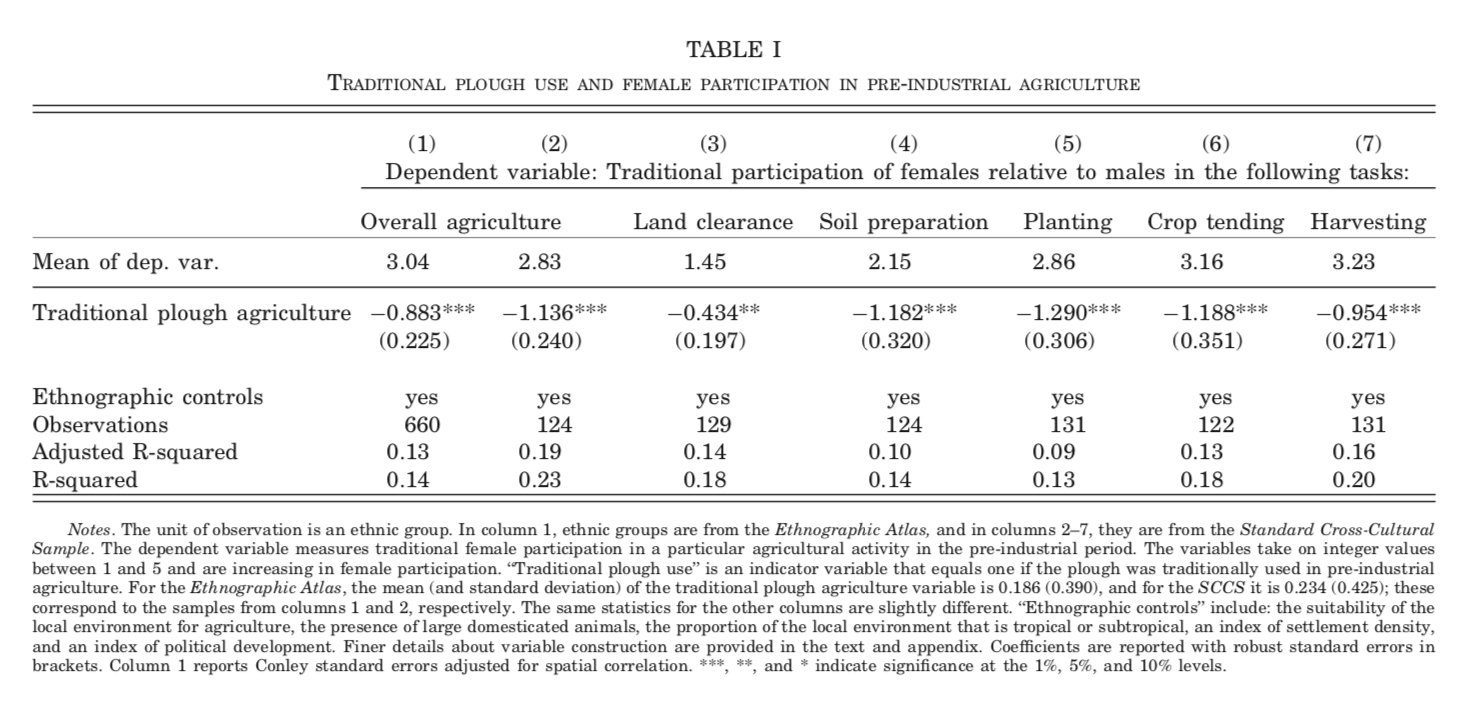
These first results show a negative relationship of traditional plow usage and the participation of women in agricultural tasks. This is no country-level, but rather ethnic-group level. The difference in columns (1) and (2) is that the first uses the Ethnographic Atlas (limited data but more groups), while column (2) and the remaining columns use the Standard Cross-Cultural Sample (more data, fewer groups). Regardless, more plow use is associated with less participation of women in these agricultural tasks. The speculation is that as animal-drawn plow use involves brute force, it favors male labor in agriculture, and this leads men to take on more of all agricultural tasks.
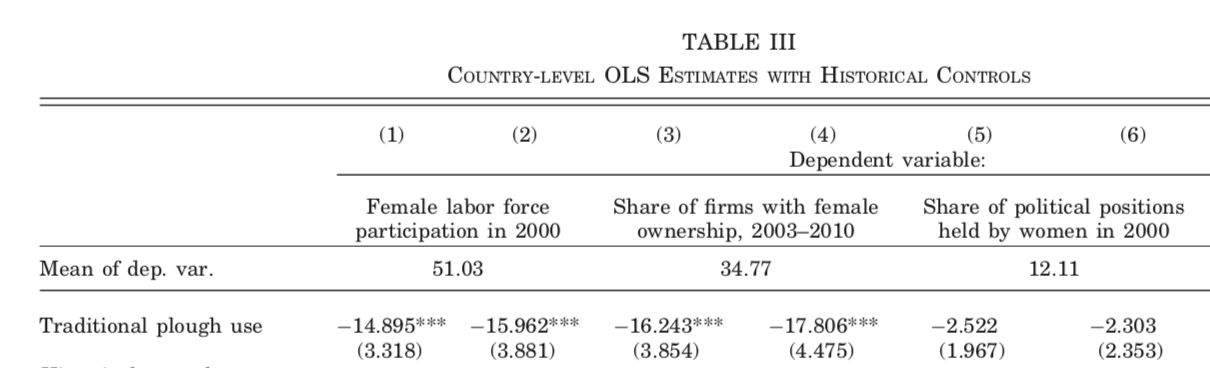
The more interesting fact they document is that this persists to differces in labor force participation in 2000. Their Table 3 (which I cut off a bunch of ancillary crap from) finds the negative relationships you see. Fewer women work in a country when the ethnicities making up that country were traditional plow-users. The effect size is substantial, with a 15 point drop in participation comparing full plow-use to non-plow-use, on a mean of 51%. You also see an effect on firms with female ownership, although nothing for political positions. Similar to the rice/wheat differences, this suggests persistent cultural effects associated with the type of agriculture done.
Geography, history, and long-run outcomes
The lesson from all these examples is that while the gross level of agricultural productivity may be central to where economic activity takes place, the kind of agriculture done has important follow-on effects that affect how this translates to living standards. The different types of agriculture - plow vs. non-plow, rice vs. wheat, etc. - created variation in cultural and institutional outcomes that influenced economic activity as well. Therefore we have places of high agricultural productivity with very different long-run outcomes, and places of low agricultural productivity with very different long-run outcomes. There is no straight line from agricultural productivity to high GDP per capita.
On top of that, historical circumstances generated different responses to the agricultural conditions in place. To give you a stark example of what I mean, consider the distribution of “caloric suitability” across the world prior to colonization. This caloric suitability comes from Galor and Ozak, and it is an attempt to measure the raw calories that an area of land could produce. In short, they look at the raw yield (in tonnes) that each crop in a given area could produce, multiply that by the calories per tonne, and then look for the maximum of total calories across all crops. Given the adjustment for calories, this tends to make places that can grow rice or potatoes look good (both very calorie dense) relative to other staples.
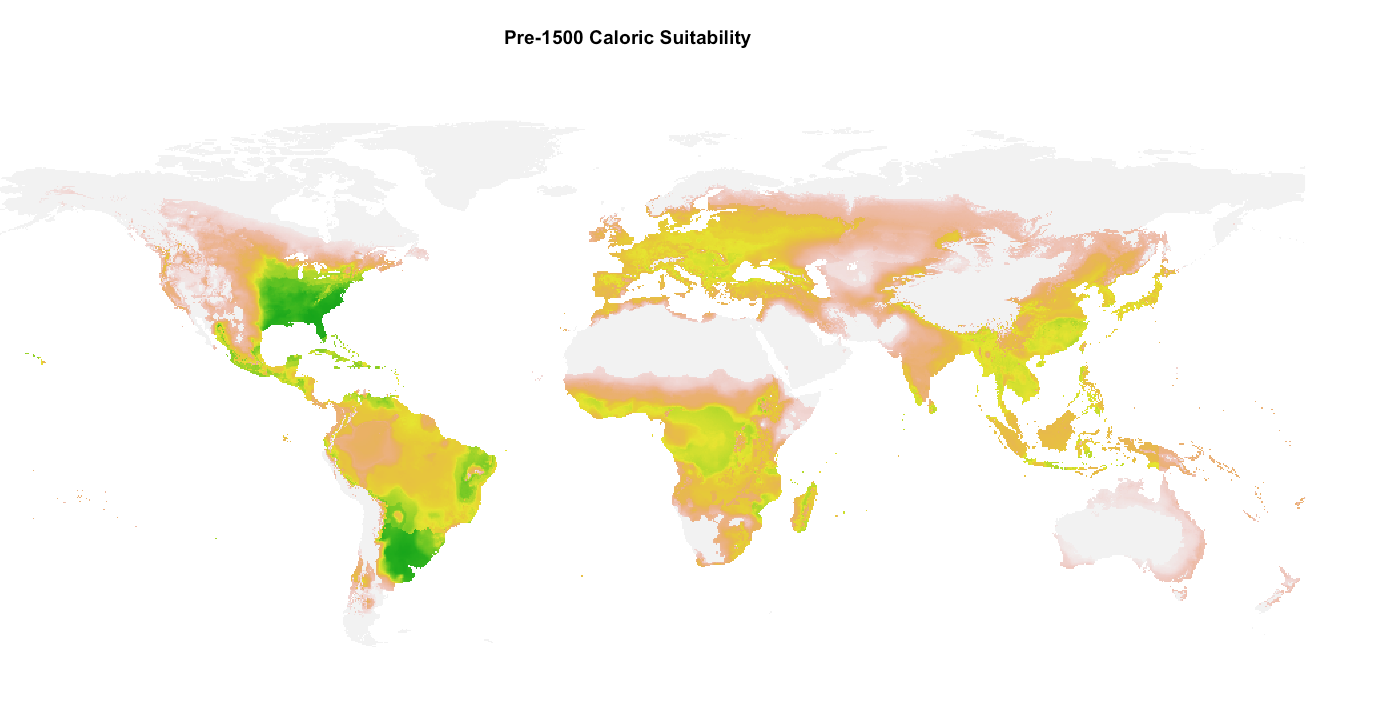
The darker the green in this figure, which plots their data, the more calorie suitable a pixel is. The striking thing about this map is the massive calorie potential in the eastern US, and in the River Plate basin. But remember that this is for the per-1500 period before colonization. Those two areas were not, at that point, anywhere close to the most densely populated places on the planet, nor would either have been a clear leader in living standards. Pure agricultural productivity was not enough, apparently.
Why not? One theory is that their populations had simply not had enough time to “fill up” these areas and go through the learning-by-doing in agriculture that would have made them as dense and technologically sophisticated as China or Europe at this time. The Neolithic Revolution and settled agriculture only took place around 3-6,000 years ago in the Western Hempisphere, while it happened around 9-12,000 years ago in the Eastern Hempisphere. If the eastern part of North America and the River Plate basin had not been colonized, we might have predicted that the indigenous populations would achieve density levels and technological sophistication equal to, or surpassing, the Old World civilizations. That didn’t happen, of course, because of colonization. Geography matters here, but so does history. It isn’t plausible to explain long-run development ignoring one or the other.