Um, this has nothing to do with health care or repealing the ACA. Sorry.
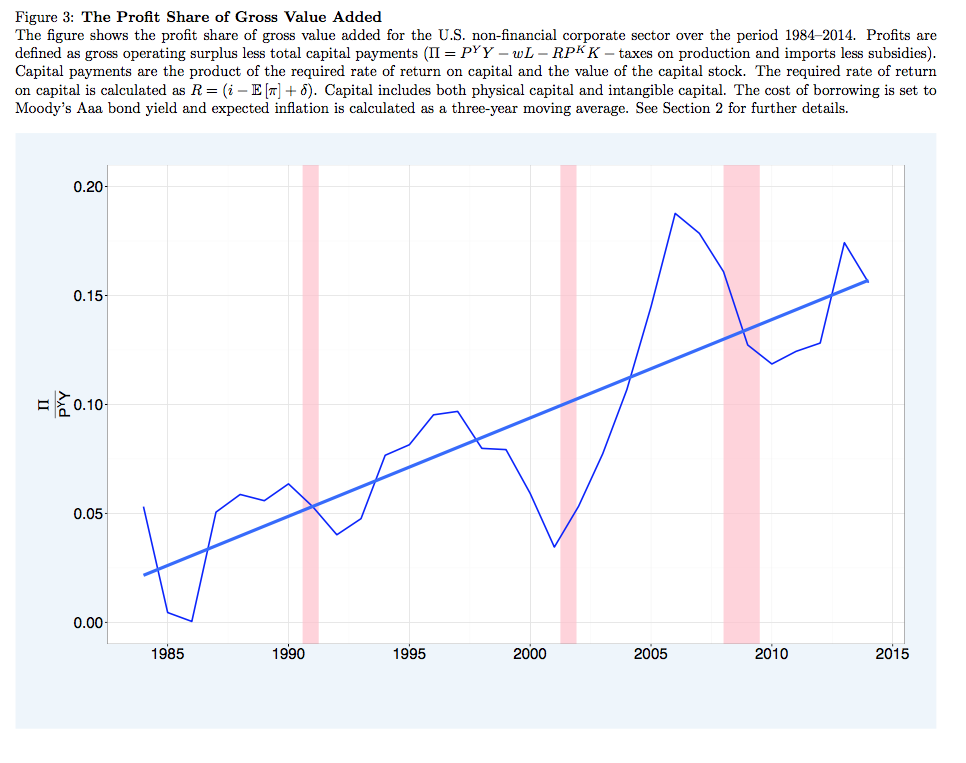
My last post was on the profit share in GDP. I drew on some work by Barkai, who calculated that the profit share in GDP had been rising steadily over the last thirty years. To save you the bother of clicking any links, here is his figure showing the profit share over time, rising from about 2.5% of GDP in 1985 to over 15% in 2014.
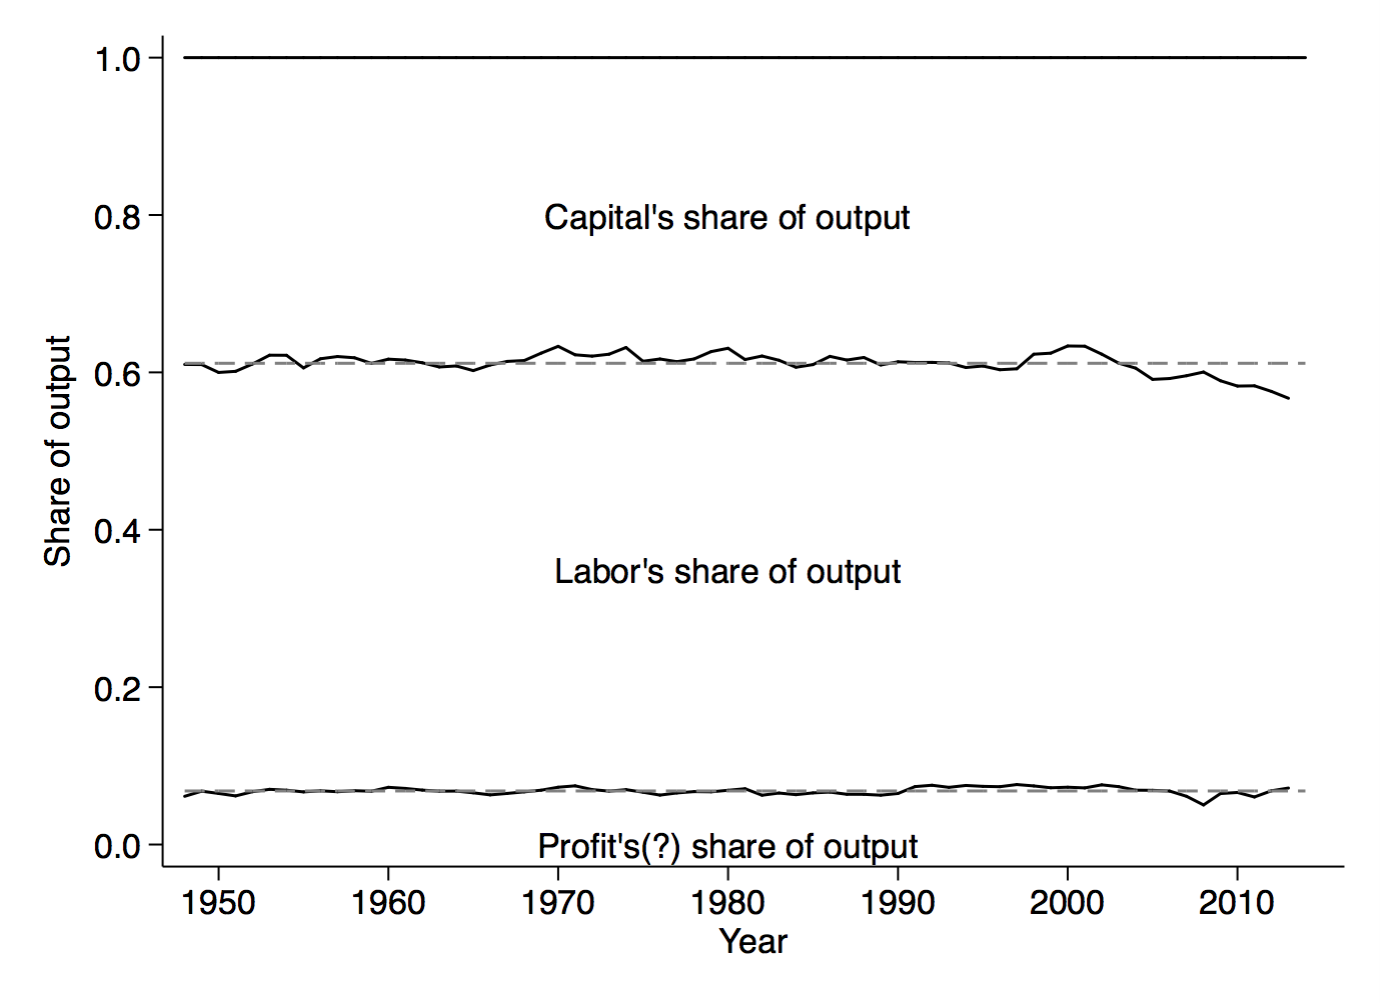
A while back, I also did some posts about how the BLS calculates multi-factor productivity. As part of that the BLS also provides a breakdown of GDP into payments to labor, capital, and profits. Here’s that figure, which runs back to 1950.
The format of the two figures isn’t the same, but I don’t believe it is too hard to see that there is a significant difference in the profit share of output in the two analyses. There is, for all intents and purposes, no increase in the profit share using the BLS data, while Barkai finds that dramatic increase.
What can explain the difference? To answer that, I have to dig into how both sources construct their estimates of the profit share. The method is similar between the two, but they differ in the data they use, so it turns out that the difference is all in the data, and that will have an interesting implication.
Calculating Profits Share of Output
First, let me outline the method they use, and why. Both the BLS and Barkai want to decompose output into something like Output = Wages + Capital Payments + Profits. This would be easy if national income accounts reported those three separate components, but they don’t. National accounts will tell you that Output = Wages + Proprietors Income + Rental Income + Corporate Profits + Net Interest + Taxes on production. Accounting-wise, it must be that Capital Payments + Profits = Proprietors Income + Rental Income + Corporate Profits + Net Interest + Taxes on production, but there is no way to know how big Capital Payments and Profits are from this. No, “Corporate Profits” are not equal to Profits. The former is accounting profits, and the latter refers to economic profits.
For both the BLS and Barkai, the solution to getting economic profits is to combine data on the total capital stock, K, with an assumption about the return to capital, R. The Capital Payments are then defined as RK, and once you know the Capital Payments, you can back out the Profits. In other words, Profits = Output - Wages - RK.
For Barkai, the value of K is taken directly from the BEA. That stock of capital, K, is broken down into a lot of categories and sub-categories are structures, equipment, and intellectual property. Structures include non-residential structures like warehouses, lodging (e.g. hotels), and amusement and recreation (e.g. Six Flags), among others. Structures also include residential structures like single family homes and apartment buildings. Intellectual property includes things like software, as well as (as of 2013), a capitalized value of R/D spending by different industries. Finally, equipment includes all the things that you normally think of as capital, like computer equipment, engines and turbines, metalworking equipment, ships, railroad, oil wells, and photocopiers (which get their own sub-category under “information processing equipment”, which I find humorous for some reason).
For R, he constructs an implicit rate of return, something like what you’d do if you tried to come up with the implicit rent an owner pays themselves if they own their home. He follows Hall and Jorgenson (1967), which assumes that investment decisions are not made randomly, but rather must reflect some economic logic, and so the rate of return R is described by R = i - g + d. i is the nominal interest rate. g is the growth rate of the price of the capital good (capital gains), and d is depreciation. The intuition of the effect of these three terms is straightforward if you spin this around into i = R + g - d. Think of a firm borrowing money to buy a capital good. They pay i as a nominal interest rate. That asset yields a return of R to them for using it, plus they get the capital gain (or loss) that goes along with the asset. The asset also depreciates at the rate d. In equilibrium, the cost of borrowing (i) should be equal to the benefit (R + g - d).
Barkai makes some assumptions to solve for R. He uses the interest rate on triple-A rated corporate bonds to stand in for the nominal interest rate i. He uses the observed inflation in the price of capital goods, available from the BEA’s data, to get his value for g. And the BEA also provides a number for the depreciation rate of different types of capital goods, based on their expected years of service, which he can use to get d. He solves for R for each of the three main types of capital goods - structures, equipment, and intellectual property - allowing each to have different values for g and d. At that point he can calculate RK for each type of capital, and then add up those total payments to get aggregate payments to capital.
Once he knows the capital payments, he can back out the Profits. And once he knows Profits, he simply calculates Profits/GDP to get profits share of output, which is what you see plotted in that first figure. There is nothing that immediately jumps out about Barkai’s method that would suggest it is wrong. Could you use a different series for the nominal interest rate? Sure. But if you jump onto the FRED database, and look at any series of nominal interest rates over time, they decline sharply from the early 1980’s until today. Is the required return to capital, R, not related to i + g - d? Maybe. But it would be weird if somehow the return paid to capital deviated a lot from that value. If the R value were in fact much lower than what Barkai calculates, then this would lower the Capital Payments even further, and in turn make profits share rise by even more, and the deviation from the BLS data would be more pronounced.
Regardless, to solve for the profit share you need to infer something about the payments to capital. What the BLS does is quite similar to Barkai. They use some different values for i, g, and d, but that isn’t what is really driving the difference in the results.
What drives the difference?
The key distinction is in the overall scope of their analysis. For Barkai, Output = GDP. For the BLS, Output = Private Business Output. The distinction is, very roughly, GDP = Private Business Output + Government + Imputed GDP from Owner-Occupied Housing. The concept of output is wider for Barkai than it is for the BLS.
This difference carries through to the capital stock that the BLS uses. For the BLS, the capital stock is a subset of the capital stock that Barkai uses. The BLS uses equipment, intellectual property, and tenant-occupied housing (e.g. apartment buildings). They exclude the stock of owner-occupied housing, which is included in Barkai’s calculations.
Mechanically the reason Barkai gets a rising profit share is that he finds a fall in the share of GDP going to Capital Payments over time. For the BLS, the share of output going to capital, as you can see in the second figure, does not change much - and when it changes, it is offset by changes in the labor share, and so there is no big change in the profit share.
Why does Barkai find a fall in the capital share compared to the BLS? It may be due to an increase in the imputed value of housing in GDP. This is going to be more clear if I drop in a real equation, so here we go
\[\frac{(RK)^{BLS}}{Y^{BLS}} > \frac{(RK)^{BLS} + (RK)^{Houses}}{Y^{BLS} + Y^{Houses}}\]The fraction on the right is the capital share in output calculated by the BLS, where $Y^{BLS}$ stands for private business output. This fraction is bigger than the fraction on the right, which is meant to capture what Barkai is calculating as the capital share. In the numerator, he has both the return on capital that the BLS would capture, but also the return on capital going to owner-occupied housing. In the denominator, Barkai has “GDP”, which is - very roughly - the sum of $Y^{BLS}$ and the imputed flow of GDP from owner-occupied housing, $Y^{Houses}$. For this inequality to be true, we need that the payments to capital for houses are not “too big”, but the imputed flow of GDP from owner-occupied housing, $Y^{Houses}$ are “very big”.
Here’s the thing. If the imputed GDP from owner-occupied housing is very high, but the payments to capital required by housing are small, then by implication the profits on owner-occupied housing are high. The rise in profits share seen in the Barkai paper could well be driven by the market power of house owners, and not by the market power of corporations, which is the intuitive response.
Profits on housing
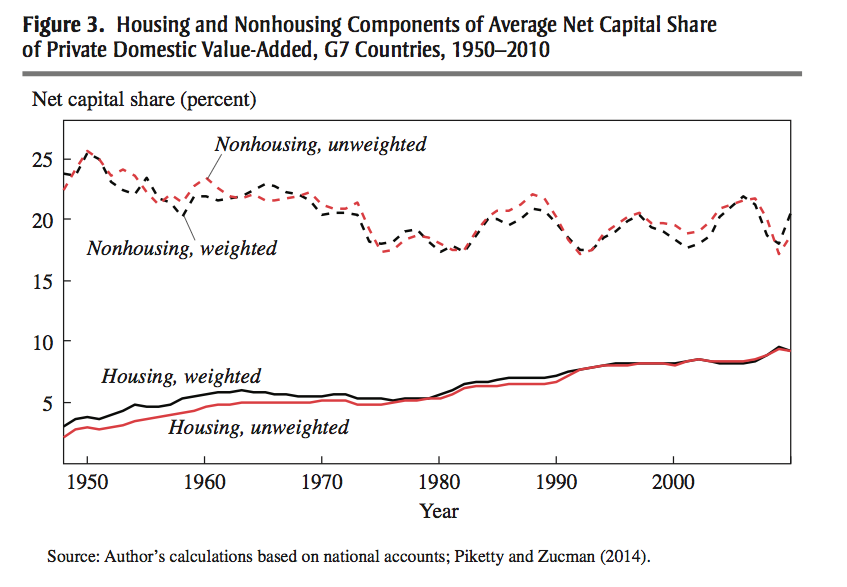
This seems to jive with other information. The figure below is from Matt Rognlie’s work. Rognlie is looking not at the separate shares of output going to profits and capital, but rather their sum. If you like, he is interested in the share of GDP not going to labor. What he did was to decompose this total non-labor share into a part accounted for by housing, and for a part accounted for by non-housing. As you can see in the figure, the share of GDP going to housing (either as a return to capital or as profits) was increasing from 1950 to today. It rose from about 3% of GDP to about 10% in this period of time, while the share of GDP going to non-housing capital (either as a return to capital or as profits) was declining slightly. Combined, these two trends lead to a rise in the share of GDP going to capital as a whole, and was one of the key elements of Piketty’s book.
Rognlie’s decomposition is consistent with the story about rising profits in owner-occupied housing. The total amount of GDP getting paid to owners of homes is rising over time (Rognlie). But at the same time, the required rate of return on capital is falling (Barkai and BLS), which means that the profits on owner-occupied housing must be rising.
What do I mean by profits? Remember that these are economic profits, not accounting profits. Owners of homes are not seeing an increase in their cash flow. As a home owner, I can assure you that my house does nothing but suck in cash, as opposed to producing it. Those economic profits are coming in the form of a higher imputed flow of GDP from my house over time. This implicit flow of value, a rent I’m charging myself, is getting cranked upwards over time, even if I don’t see it.
To think about how this works out as an economic profit, consider the following example. Let’s say you can take out a mortgage at 4%. That’s the nominal interest rate i. Let’s say houses depreciate at 1% per year, and you expect capital gains on your house to be something like 2% per year. Then the required rate of return to break even would be R = 4 - 2 + 1 = 3%.
If your house is worth 500,000, a 3% return would mean charging 15,000 in rent per year, or 1,250 per month. Now, if you look out at the market and find out that you could actually rent your house out for 2,000 per month, you are making 750 in economic profit. The price you can charge for your house, 2,000, is higher than the marginal cost to you, 1,250. Profits!
It doesn’t matter if you are paying yourself that rent or not. If your house can rent for more than the marginal cost, then you are making profits. The rise in the profit share in the Barkai analysis may be driven in part - or maybe mostly? - by the rise in the imputed value of rents going to owner occupied housing. If the BEA is overstating the value of the flows going to home-owners, fine, but then the implied increase in the profit share in Barkai’s analysis is overstated as well.
The implications of an increasing profit share coming from owner-occupied housing are a lot different from the implications of an increasing profit share coming from corporate market power or concentration. I need to think a lot harder about housing, it seems.