Competition and growth

Evidence on competition
The prior section explained that some profits are needed to stimulate innovation. What we will do here is establish that the relationship of innovation and profits is not as simple as “more profits, more innovation”.
To see what we’re trying to explain, the following is taken from a paper by Aghion, Bloom, Blundell, Griffith, and Howitt that looked at data from the UK to see how competition was related to innovation. They measure the “level of competition” using a formula like this
\[Competition = 1 - \frac{Rev - Costs}{Rev} = \frac{Costs}{Rev}\]for each industry. The second fraction is the informative way to see their index. If costs are very close to total revenues, then profits (Revenue minus costs) are very close to zero, and this indicates the industry has a lot of competition. Either it is easy for new businesses to enter, driving down prices (and revenues) for existing competitors, or the existing businesses are selling similar products (HD TV’s) with similar features and hence no one can charge much more than cost. Either way, if the index approaches 1, then the industry is highly competitive.
On the other hand, if the industry is uncompetitive, then this is going to show up as one or more firms have high revenues relative to their costs - high profits - and hence the competition index of costs/revenue is going to be low.
In the figure below, this competition index for industries is on the X-axis. On the Y-axis is a measure of how innovative each industry was. That is measured by using not just by how many patents were issued by each industry, but by how important those patents were. When a patent is really useful, it will get cited a lot by other patents. The index of innovation captures whether industries were creating important patents.
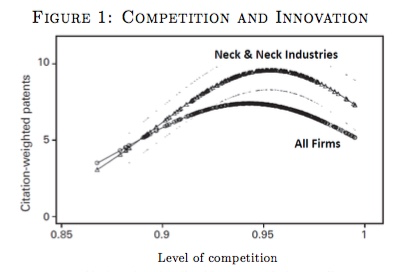
What you can see is a distinct hump-shape. When competition is low, innovation tends to be low. But it is also the case that when competition is very high, innovatino tend to be low. Innovation seems to be maximized in industries that have medium amounts of competition. The authors further break down the results by whether industries are “neck-and-neck”, meaning the leading firms have very similar levels of productivity. In those industries, there is more innovation across the board, no matter how competitive the industry is to begin with.
We can put together some mathematical models of how this works, but that takes us pretty far astray into doing what is really industrial organization research on firm-level forms of competition and innovation. These models are at the cutting edge of modern economic growth research, but won’t add a lot to the basic intuition I’m about to describe.
So what is going on in this figure? Let’s think through three types of industries, and the incentives for innovation they have.
-
Very competitive industries: In these industries, the economic (and accounting) profits that a firm can earn are very low. It is either very easy for competitors to enter the industry or the product is a homogenous product. Think of gas stations. Even if a firm were to innovate, the profits available to it are very small to begin with, and it may be easy for all its competitors to copy its innovation. There may be little IP protection for innovations in these industries. Again, think of gas stations. They can try to tell you they’ve innovated (“Chevron with Techron!”) but let’s face it, it’s just gas. Firms in these industries don’t have a lot of incentive to spend time innovating, because why bother?
-
Very un-competitive industries: In these industries, there is a dominant player or perhaps a few firms that have colluded to divide up a market. They face almost no competition to their product. It may be because the costs of entry are huge either because of technical reasons (cable companies, airlines) or because of network effects (Google) or something like that. These firms also do not have a lot of incentive to innovate, because why bother? They already earn profits, and since no one can steal their business, providing their product more cheaply or at a higher quality doesn’t do them a whole lot of good.
-
Medium-competitive industries: These are in the sweet spot. The firms that produce in these industries are able to earn significant profits because they make something that is differentiated and valuable to people (Apple, Samsung?), but the presence of a competitor and/or new entrants means they cannot just sit around or they’ll lose market share. Each of the firms in these industries has to scramble all the time to innovate just to stay ahead of their competitors (or to keep up).
We didn’t prove anything formally here, but the intuition gives rise to this important point.
There is a medium level of competition among firms - neither perfect competition nor monopolies - that maximizes economic growth.
In economics we normally make a big deal about how perfect competition is the most efficient form of market organization. But note that this is a statement about the level of economic output given a level of productivity. If productivity were held constant, then we’d want all industries to be perfectly competitive, as that would maximize production. But if we’re thinking about growth in productivity, we don’t want perfect competition because this would limit innovation.
Combine this with the finding from the last section about profits and the payments to rival inputs, and you see that growth requires the economy to be operating in a murky area far away from theoretical ideals.
We don’t know precisely where the sweet spot is, and thus it is very possible that we have too little or too much competition in the economy to maximize growth, or that we are over or under-paying rival inputs relative to what would maximize growth. There is no clean answer to what economic conditions maximize innovation and economic growth.
Competition and the level of innovation
Let’s go back to our simple model of choosing $R_t$ from the prior section to think about how the findings in the above section work. This is just putting some math behind the words above.
We came up with this equation
\[\frac{s_{\pi} Y_t}{A_t}\frac{dA}{s_R L_t} = \frac{s_L Y_t}{L_t}.\]that told us how a hypothetical firm would decide to allocate workers to research work. But in building that up, I made a very stark assumption that wasn’t discussed. This equation doesn’t take into account the current profits a firm might be earning. Or if you like, it assumes that the firm we are talking about is earning zero profits to begin with.
The left-hand side was the marginal benefit of profits, but that marginal benefit would be lower if the firm innovated and lost some existing profits. Think of Apple deciding to introduce a new iPhone. A very important consideration for them is the fact that they will be cannibalizing the profits of their old phones when they do that.
We need to replace the profits-per-idea term with something like this
\[\left(\frac{s_{\pi} Y_t}{A_t} - \pi^{Old}_t \right)\frac{dA}{s_R L_t} = \frac{s_L Y_t}{L_t}\]where $\pi^{Old}_t$ are the profits that a firm would lose if it innovated. These are the lost profits from iPhone 14s when Apple introduced the iPhone 15.
Now go back and think through the different types of industries again. In very competitive industries, the share of profits they actually can recoup is quite small, so for them $s_{\pi}$ is close to zero, and their existing profits are zero, so the equation is something like
\[\left(0 - 0\right)\frac{dA}{s_R L_t} = \frac{s_L Y_t}{L_t}\]and it doesn’t really matter what the process is for accumulating new ideas or the wage rate is. The only solution here is to set R to zero. There is no marginal benefit to doing research.
In a very un-competitive industry, they already are earning profits, and no one can replace them either because of IP or because they are so far ahead. So now this looks like
\[\left(\frac{s_{\pi} Y_t}{A_t} - \frac{s_{\pi} Y_t}{A_t} \right)\frac{dA}{s_R L_t} = \frac{s_L Y_t}{L_t}.\]The profits that the firm in the un-competitive industry earns from an innovation are offset by the lost profits from their old product. Again, the term on the left is close to zero, and there is no incentive to do research. This is sometimes referred to as the Arrow replacement effect, which is the concept that firms don’t want to innovate to replace themselves. That is a waste of resources.
Finally, the “medium” competitive industries have something like this going on:
\[\left(\frac{s_{\pi} Y_t}{A_t} - 0 \right)\frac{dA}{s_R L_t} = \frac{s_L Y_t}{L_t}\]where they currently have very few profits (because they are in competition with other firms) but if they could innovate they could jump out and grab some big profits. So the incentive here is pretty big, and we get positive values of $s_R$.
The question of how big $s_R$ is for the whole economy thus depends a lot on the distribution of firms across these kinds of markets. The more medium-competitive firms there are, who have real incentives to do innovation, the more innovation we get. The more monopolies we have or the most hyper-competitive markets we have the less innovation there is. There is a sweet spot for innovation that involves some competition but not too much.